Wetland Vegetation Accuracy Assessment: A Practical Guide to Ground Truthing AI Detection
Nov 1, 2026
Written by: Boshra Rajaei, PhD
Written by: Boshra Rajaei, PhD
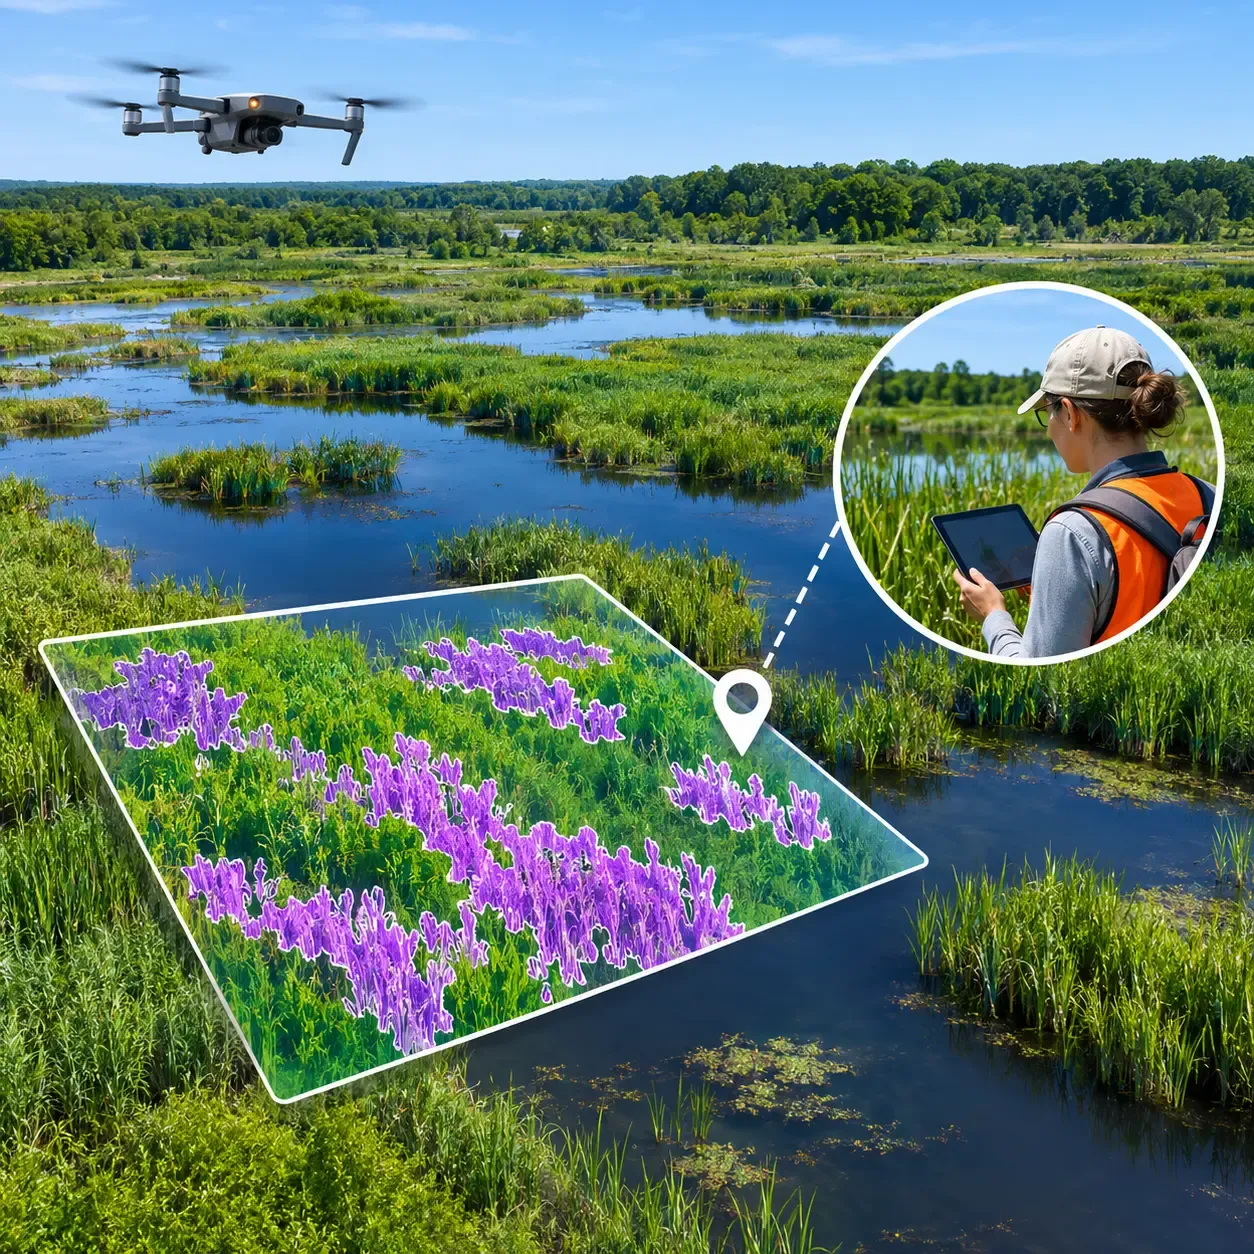
Wetland vegetation maps can help conservation teams identify invasive plants, monitor habitat changes, and prioritize fieldwork. Drones and artificial intelligence (AI) make it possible to analyze large areas of imagery, but an AI-generated map is not automatically an accurate representation of conditions on the ground.
A vegetation detection system may identify the correct plant in one part of a wetland while confusing it with visually similar species elsewhere. Water reflections, changing vegetation patterns, and differences between image collection and field survey dates can complicate the results.
Wetland vegetation accuracy assessment is the process of comparing mapped predictions with reliable reference observations to determine how well a map represents actual vegetation.
This guide explains how to plan ground-truth sampling, validate AI-generated vegetation maps, calculate accuracy metrics, investigate errors, and decide whether the results are reliable enough for their intended purpose.
Wetland vegetation accuracy assessment evaluates the agreement between vegetation classes or detections shown on a map and independently collected reference information.
For example, an AI model may classify aerial imagery into categories such as:
An accuracy assessment checks whether those predictions match reference observations at selected locations.
The reference information may come from field surveys, carefully interpreted high-resolution imagery, or a combination of sources. The important requirement is that it provides a sufficiently reliable basis for evaluating the map.
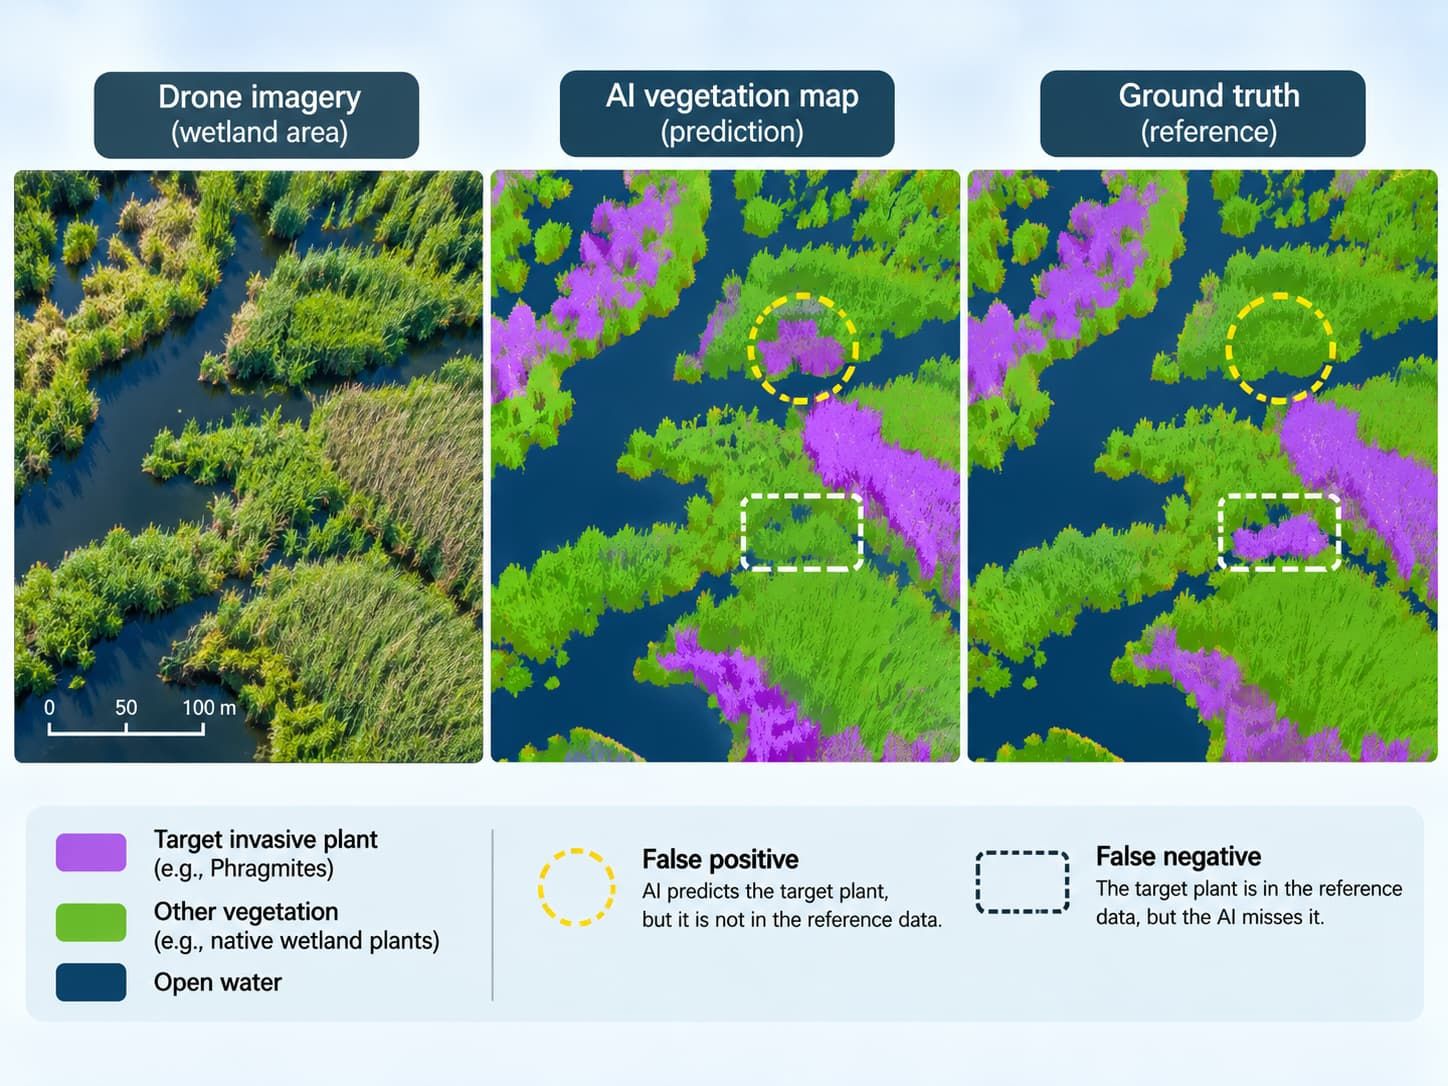
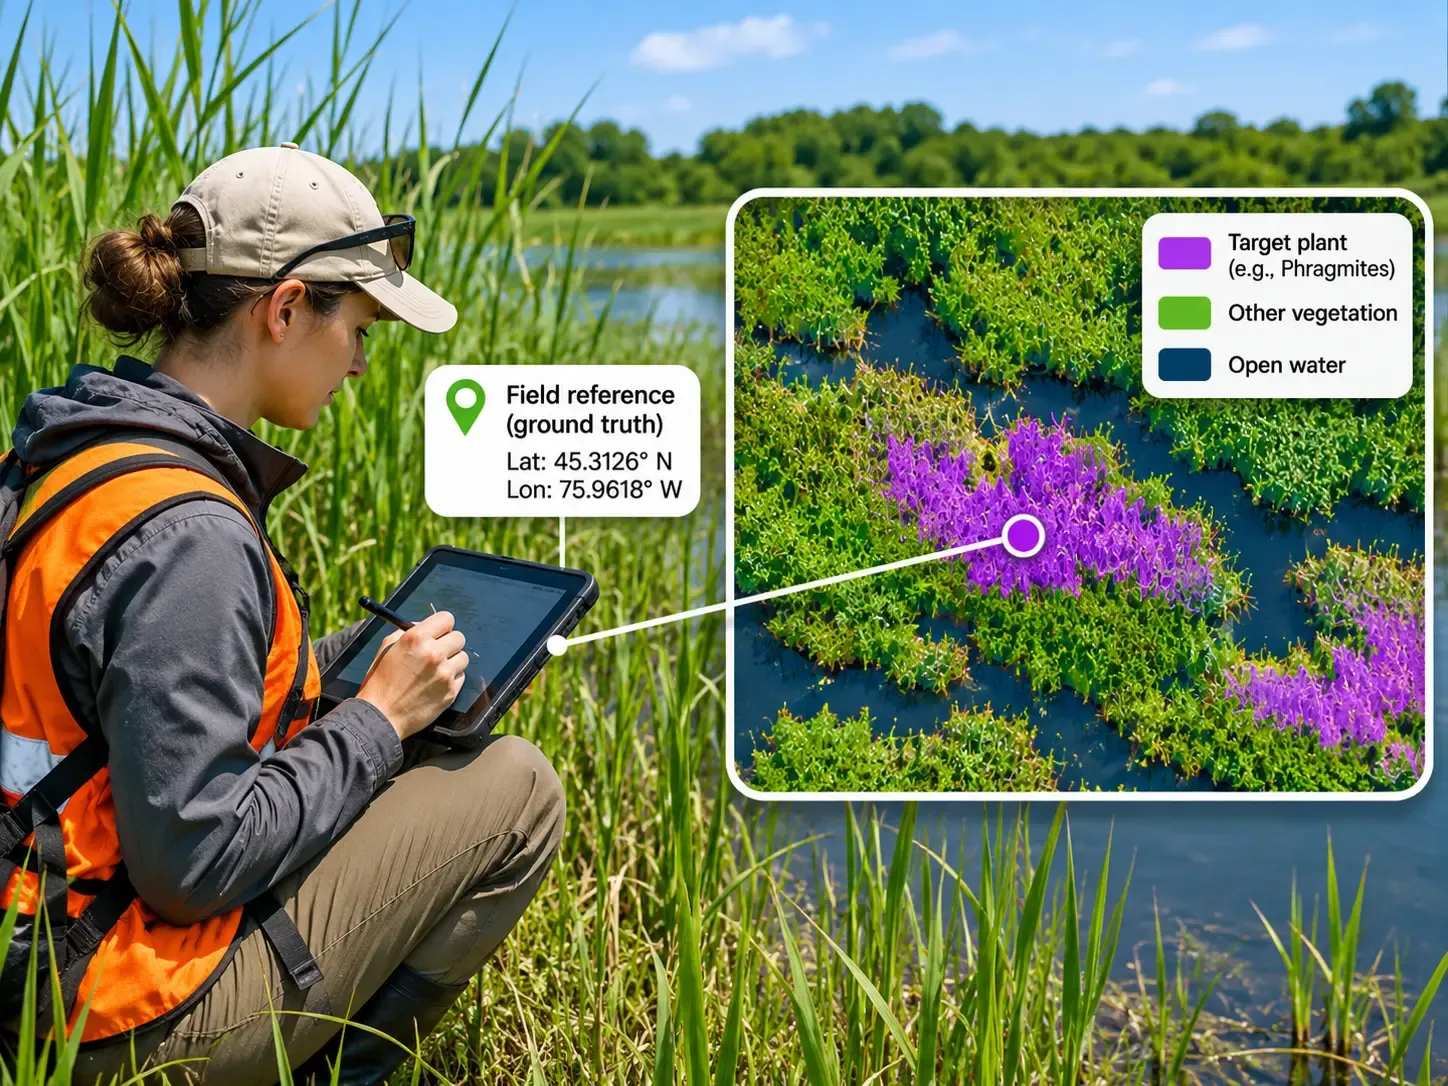
Ground truth is a term commonly used for observations treated as the reference standard. In practice, reference data can also contain errors, so their collection and quality should be documented.
Training data and validation data serve different purposes.
Training data help a machine-learning model learn how to recognize vegetation. Validation data provide an independent check of how the trained system performs.
If the same locations or closely related imagery are used for both training and evaluation, the reported accuracy may be overly optimistic. A defensible assessment should consider independence at the level of sites, spatial areas, and acquisition dates—not just individual image files.
For broader guidance on improving model predictions, see Sairone's article on reducing misclassification in AI invasive-species detection.
An accuracy assessment begins with a practical question:
What decision will this vegetation map support?
A map intended to locate possible invasive-plant patches for follow-up surveys may have different requirements from one used to estimate affected area or compare vegetation cover across several years.
Before collecting validation samples, define:
For invasive-plant surveillance, a missed patch may delay follow-up work. For treatment planning, a false positive may direct crews toward vegetation that does not require intervention.
These differences should influence which accuracy metrics receive the most attention.
Not all AI vegetation outputs should be evaluated in the same way.
A classification map assigns categories to spatial units such as pixels. A segmentation model may outline plant-covered areas. An object-detection system may produce bounding boxes or other individual detections.
Each output requires a suitable matching rule between predictions and reference observations.
For example, checking whether a point falls inside a predicted invasive-plant area is not the same as evaluating whether the mapped boundary of that area is accurate.
A validation dataset should represent the vegetation and conditions within the study area.
Selecting only obvious examples of a target species can make a model appear more reliable than it is. Wetland assessments should also consider mixed vegetation, transition zones, sparse infestations, and areas where target species resemble surrounding plants.
Probability-based sampling methods allow analysts to make more defensible statistical inferences about map accuracy.
Common approaches include:
Simple random sampling: Reference locations are selected randomly throughout the study area.
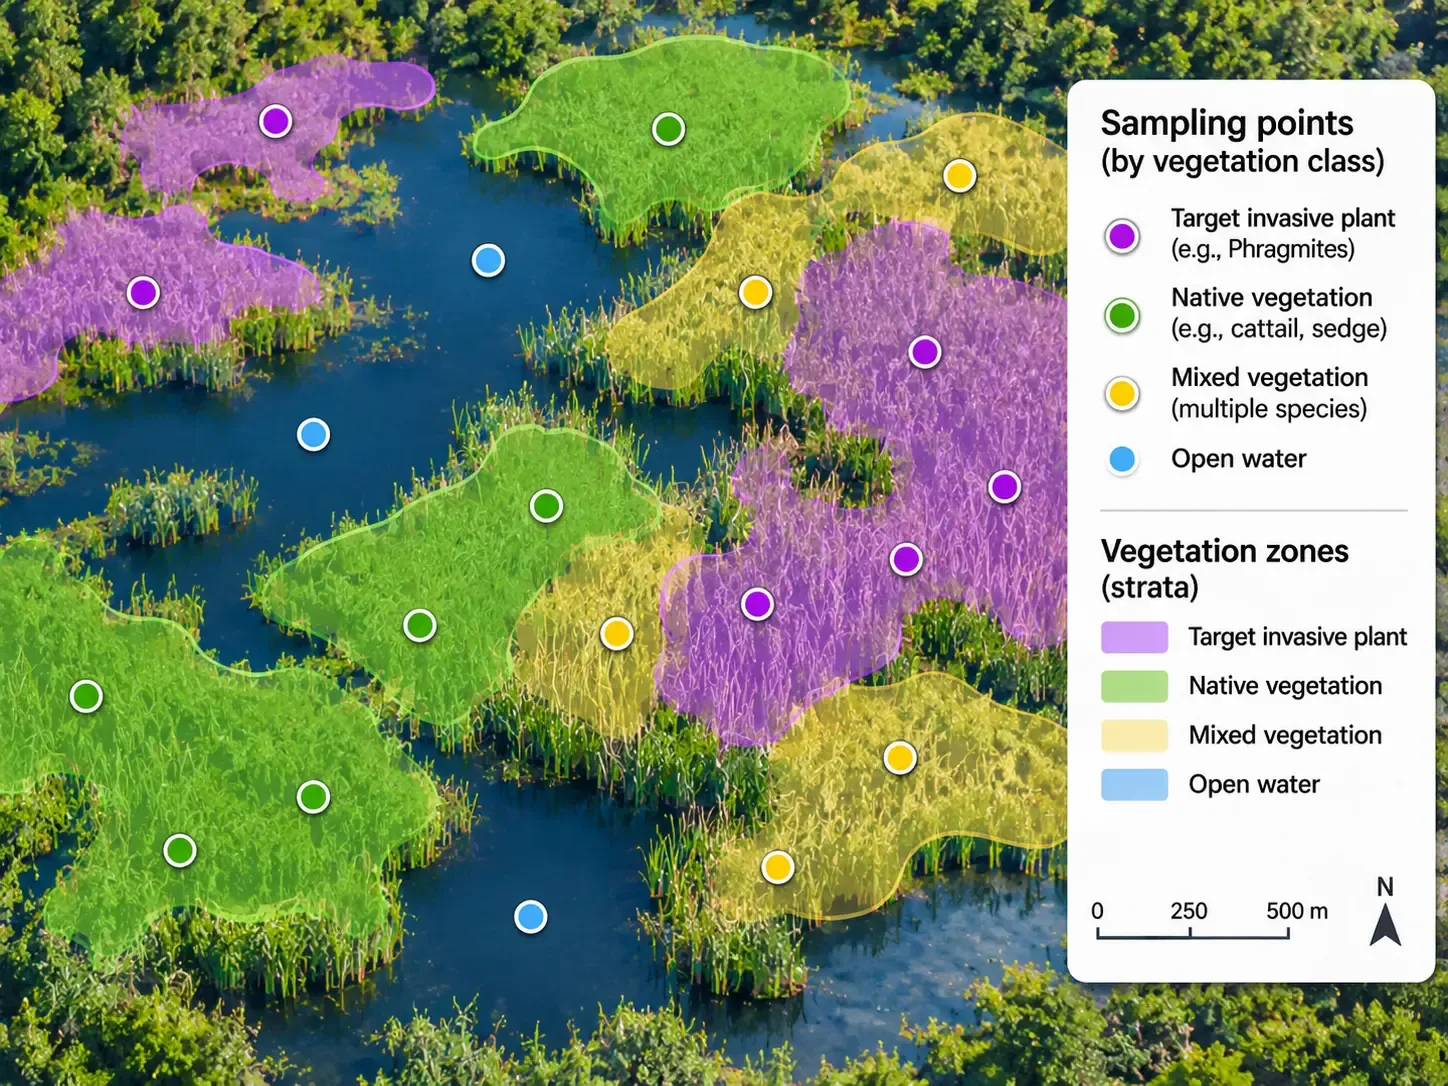
Stratified random sampling: The area is divided into meaningful groups, such as mapped vegetation classes, and reference samples are selected within each group.
Systematic sampling: Locations are selected according to a regular spatial pattern, often with a randomized starting point.
Stratification can be particularly useful when a target invasive species occupies a relatively small portion of the wetland. It allows the validation plan to include enough observations from important or uncommon mapped classes.
However, deliberately collecting equal numbers of samples from each class changes the sample distribution. Overall accuracy and area estimates may then require design-based weighting to represent the full study area correctly.
Nearby image patches often share similar vegetation, lighting, and background conditions. Splitting neighboring patches randomly between training and validation sets can produce misleadingly favorable results.
Where appropriate, hold out separate wetland sections, survey sites, or acquisition dates to evaluate how the model performs beyond the conditions represented in its training data.
The sampling plan should document how locations were selected and which observations were excluded.
There is no universally correct sample count.
The appropriate number depends on the number of vegetation classes, the prevalence of each class, expected variability, desired statistical precision, and the available field budget.
Rather than choosing an arbitrary fixed number, define the desired confidence and precision of the assessment, then develop a sample-size plan that matches the intended analysis.
A reference observation is useful only when it can be matched reliably to the mapped location and vegetation condition.
For each reference sample, record:
| Field | Why it matters |
|---|---|
| Sample identifier | Connects field observations to map records |
| Geographic coordinates | Locates the observation within the imagery |
| Observation date | Helps identify seasonal or temporal mismatches |
| Vegetation class or species | Provides the reference label |
| Observation method | Documents how the label was determined |
| Confidence or uncertainty | Identifies ambiguous observations |
| Supporting photographs | Allows later review of difficult cases |
| Observer or reviewer | Supports quality control and traceability |
A field GPS point and an image-derived vegetation boundary may not align perfectly.
Positioning errors can be especially important near narrow vegetation strips, small patches, or boundaries between water and emergent plants.
When assessing a mapped pixel or polygon, define how the reference location will be matched to the prediction. Avoid treating every disagreement near a boundary as a biological classification failure without first checking positional uncertainty.
Wetlands can change substantially between surveys.
Water levels, plant growth stages, seasonal senescence, and management activities may alter the visible landscape. A reference observation collected long after the drone flight may describe a different condition from the one captured in the imagery.
Ideally, collect field observations close to the image acquisition date. When that is not possible, record the time difference and consider its implications.
Observers should use the same vegetation-class definitions and decision rules.
For example, a validation protocol should specify how to label mixed stands, sparse vegetation, uncertain species identifications, and locations where the target plant is partially obscured.
Ambiguous samples should be flagged for review rather than silently forced into a class.
Once the reference dataset is ready, compare each reference observation with the corresponding map prediction.
For a classification map, the results can be summarized in a confusion matrix, also called an error matrix.
The matrix shows where predictions agree with reference labels and where they differ.
Suppose a conservation team evaluates an AI map intended to detect one target invasive plant. The team checks 100 independent reference locations.
The following numbers are illustrative only. They are not measured Sairone performance results.
| AI prediction | Reference: Plant present | Reference: Plant absent |
|---|---|---|
| Plant present | 40 | 10 |
| Plant absent | 5 | 45 |
The results include:
This matrix provides more useful information than reporting a single accuracy percentage.
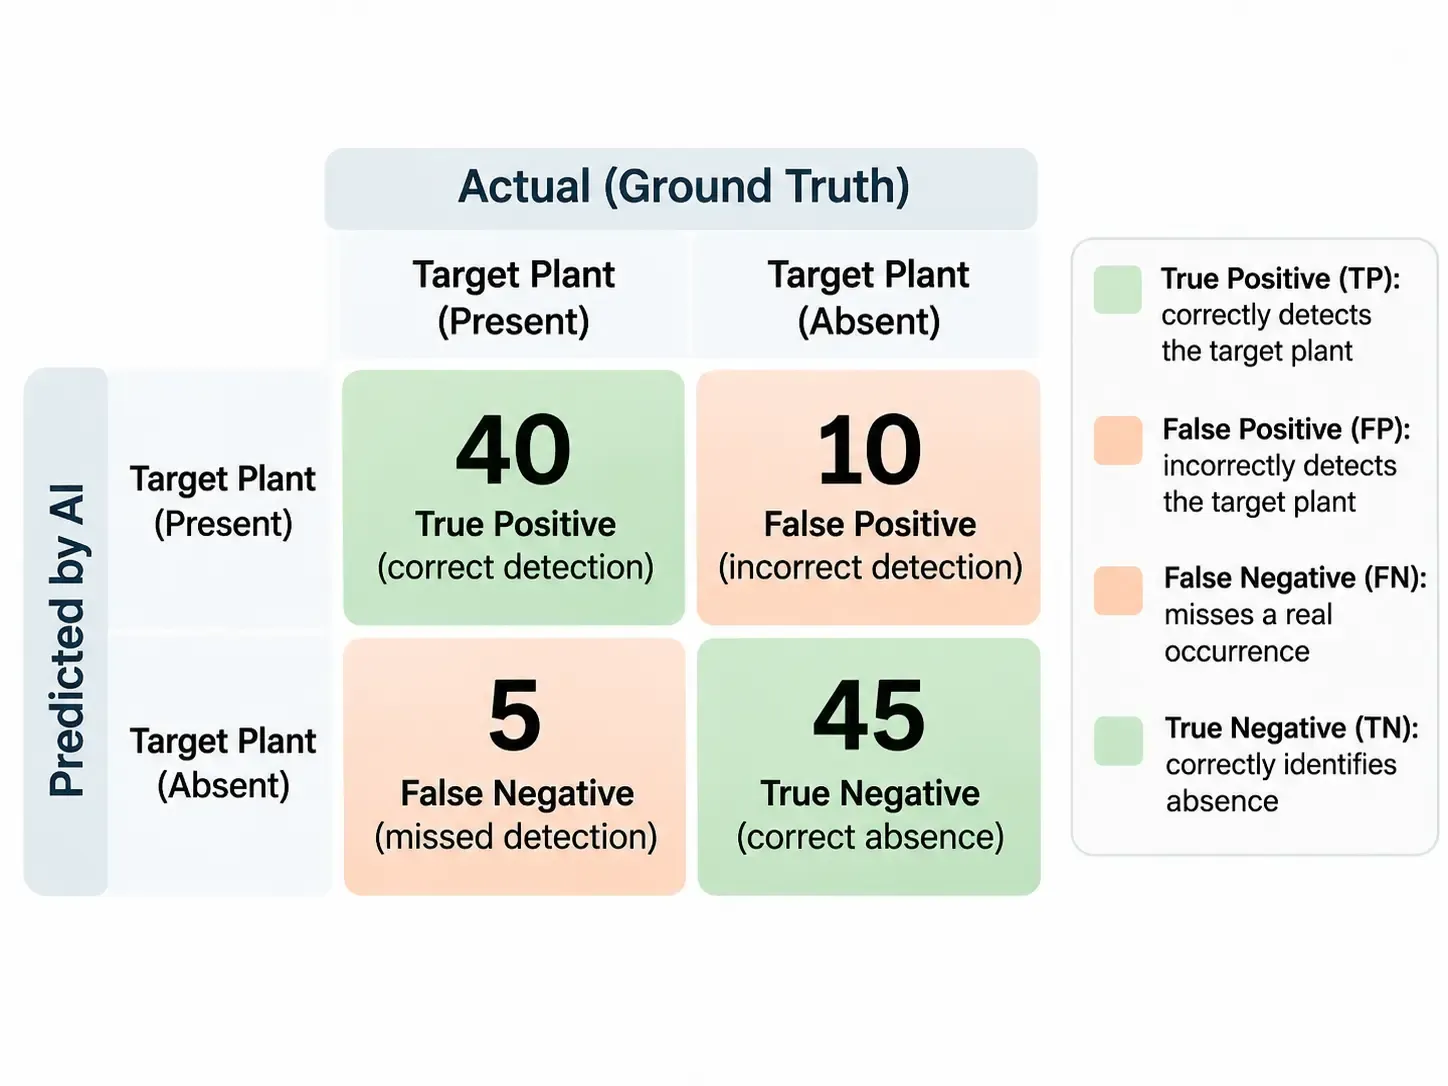
Different metrics answer different operational questions.
Overall accuracy is the proportion of reference observations classified correctly.
Formula:
Overall accuracy = (True positives + True negatives) / All observations
In the example:
(40 + 45) / 100 = 85%
That means 85 of the 100 reference observations were classified correctly.
However, overall accuracy can hide poor performance on an uncommon but important invasive species. A map dominated by open water or non-target vegetation may achieve high overall accuracy even while missing many target plants.
For the target-present class, precision is:
Precision = True positives / (True positives + False positives)
40 / (40 + 10) = 80%
In this example, 80% of the locations predicted as containing the target plant were confirmed by the reference observations.
For a standard class-based confusion matrix, this corresponds to user's accuracy for the target class, provided the same class definitions and sampling interpretation are used.
Precision is especially relevant when false detections could trigger unnecessary field visits or management actions.
Recall is:
Recall = True positives / (True positives + False negatives)
40 / (40 + 5) = 88.9%
The model detected approximately 88.9% of the target-present reference locations in this example.
For class-based map assessment, this corresponds to producer's accuracy for the target class under the same evaluation framework.
Recall matters when missing a target species could delay monitoring or management.
The F1 score combines precision and recall into a single measure.
F1 = 2 × (Precision × Recall) / (Precision + Recall)
Using the example values:
F1 ≈ 84.2%
F1 is useful for comparing detection performance, but it does not replace separate reporting of false positives and false negatives.
When a model produces vegetation masks or polygons, the overlap between predicted and reference areas may also matter.
Intersection over Union (IoU) compares the shared area of two spatial regions with their combined area.
IoU = Overlapping area / Total area covered by either region
A prediction may correctly identify that a Phragmites patch exists while still outlining its boundaries poorly. Class-level detection metrics and spatial-overlap metrics therefore describe different aspects of performance.
The example above treats all 100 observations equally.
If the validation sample deliberately includes more observations from rare vegetation classes than occur in the landscape, simple counts may not produce an unbiased estimate of overall map accuracy.
For formal area estimation or statistical reporting, use estimators consistent with the sampling design, including appropriate class or area weights and uncertainty intervals.
When predictions disagree with reference observations, the next task is to understand why.
Wetland imagery presents several challenges that may affect vegetation classification.
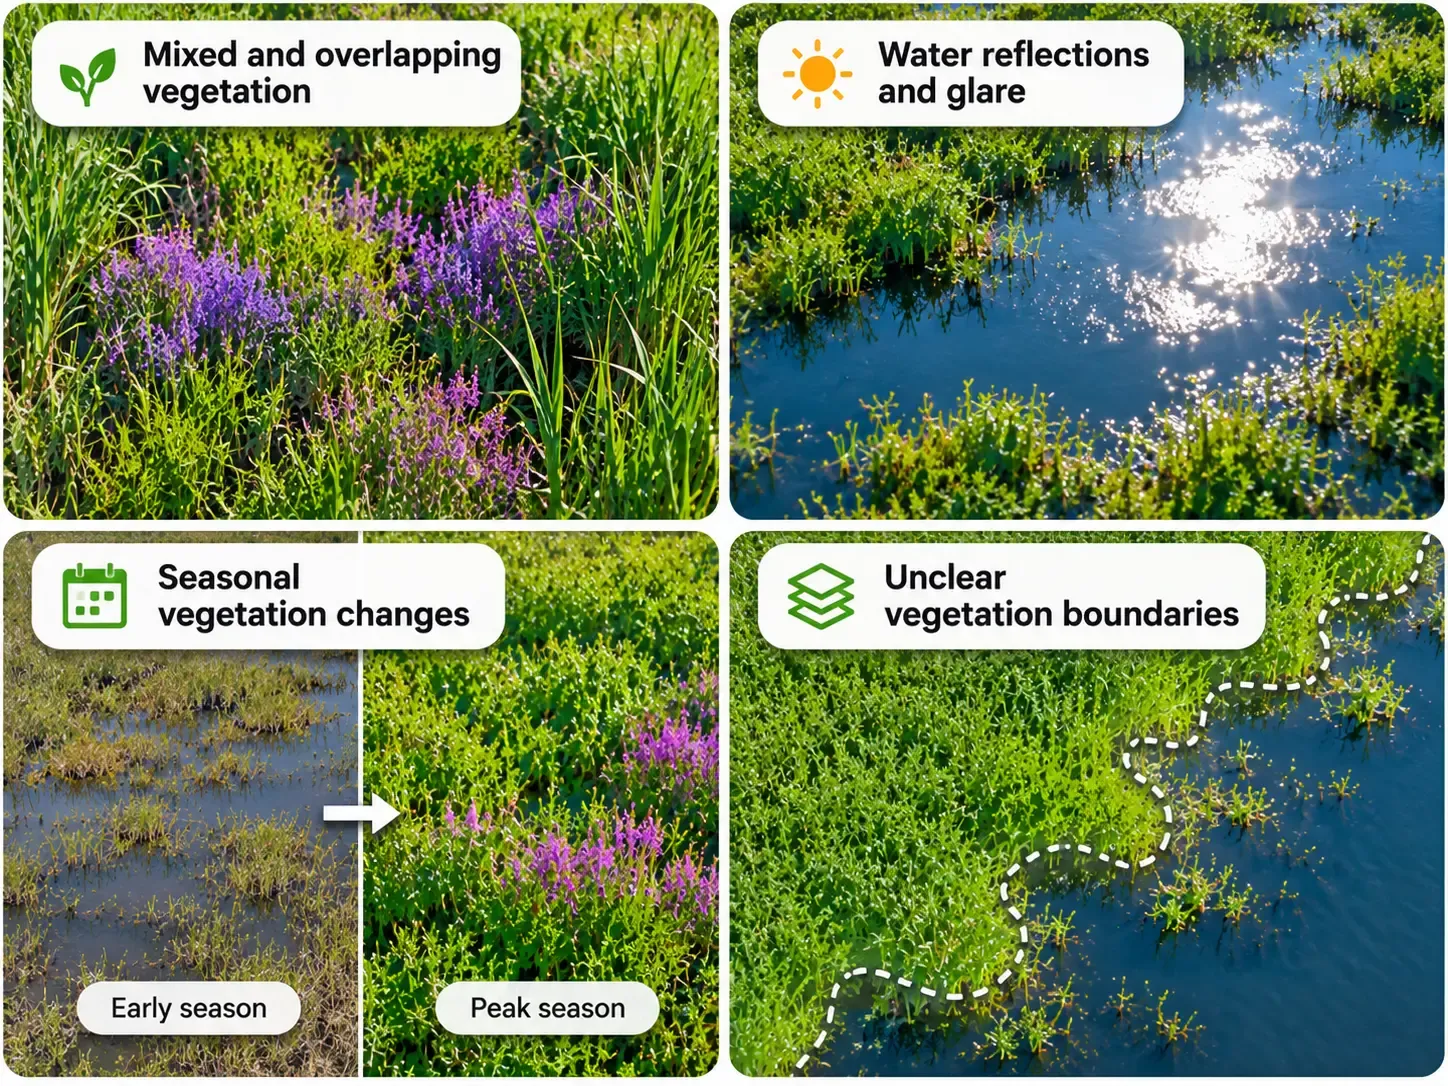
Different species may grow together in the same image region.
A model may correctly recognize a dominant vegetation type while missing a less visible invasive species growing beneath or between other plants.
These areas should be reviewed separately from clearly isolated plant stands.
Sun glare, reflections, and shadows can alter the appearance of vegetation and water surfaces.
An image captured under one lighting condition may look substantially different from imagery collected at another time of day.
Recording image-acquisition conditions can help identify systematic errors.
Plant color, height, density, and visible structure can change throughout the growing season.
A model trained primarily on one seasonal stage may not perform equally well at another.
Where seasonal monitoring is part of the intended use, validation should include the relevant observation periods.
Wetland vegetation is not always equally visible from above.
Submerged plants may be obscured by water depth or turbidity. Floating vegetation can change position or distribution. Emergent plants may be partially concealed by other vegetation.
These distinctions matter when selecting imagery, defining target classes, and interpreting omissions.
For more on imagery-based aquatic plant mapping, see Sairone's guide to mapping submerged and floating invasive plants with UAV imagery.
Small patches may occupy only a few image pixels, while coarse imagery may combine multiple vegetation types into a single pixel.
Even high-resolution imagery can produce uncertain boundaries where plants overlap or where field-reference coordinates are imprecise.
A useful error review should distinguish between species confusion, localization error, and uncertainty in the reference observation.
A vegetation map does not need to be perfect to be useful. But its limitations must be understood before it informs decisions.
The acceptable balance between false positives and false negatives depends on the task.
For early screening, a team may prefer to flag more possible invasive-plant patches for field review. For treatment planning, stronger confirmation may be necessary before crews act on a mapped location.
A practical decision process includes:
If the project requires estimates of invaded area, mapped pixel counts alone may not be sufficient. Formal area estimates should account for classification error and the validation sampling design.
A model that performs adequately during one season may behave differently after changes in vegetation, water conditions, imagery, or survey locations.
Long-term monitoring should include a repeatable validation protocol, consistent class definitions, and documentation of model or data changes.
This allows teams to distinguish ecological change from changes in the mapping system itself.
Use this checklist before relying on an AI-generated vegetation map.
Monitoring objectives
The target species or vegetation classes are clearly defined.
The intended use of the map is documented.
The evaluation unit and matching rules are specified.
Reference sampling
Validation locations were selected using a documented sampling design.
Important and uncommon vegetation classes are represented.
Validation observations are independent of training data.
Spatial clustering and site-level similarity were considered.
Field observations
Reference labels follow consistent definitions.
Coordinates and observation dates are recorded.
Imagery and field-survey dates are sufficiently aligned for the intended analysis.
Accuracy analysis
A confusion matrix is available.
Target-class precision and recall are reported.
Spatial-overlap metrics are included where relevant.
Sampling weights are applied where required.
Uncertainty and important limitations are documented.
Operational review
Errors have been examined by habitat or environmental condition.
The consequences of missed and incorrect detections are considered.
Areas requiring further field verification are identified.
The map's suitability for its intended use is explicitly assessed.
AI-assisted vegetation detection can help teams turn aerial imagery into spatial information about target plants. Accuracy assessment determines how much confidence to place in that information for a particular monitoring task.
An example is Saiwa's Phragmites Detector project, developed for invasive-species monitoring in wetlands.
The published project describes the use of drone imagery and machine-learning-based segmentation to identify Phragmites patches. It also describes field-data collection, annotation, model development, and workflows for reviewing detections.
The project's published progress update, dated January 15, 2026, reports that data acquisition and annotation were completed and that a baseline model and preliminary processing workflow had been developed. It also describes ongoing custom-model development and evaluation.
That project illustrates why field-reference data and model validation matter in practical wetland monitoring. It does not establish a universal accuracy rate for Sairone, nor does it mean every validation method described in this guide is automatically performed by the platform.
For teams planning a new vegetation-detection project, the most useful starting point is to define the target species, available imagery, reference-data requirements, and the decisions the resulting map must support.
Discuss Your Project to explore how Sairone's plant-detection applications may fit your wetland monitoring needs.
Ground truth refers to observations used as the reference for checking mapped vegetation predictions. It often comes from field surveys or carefully interpreted reference imagery. Because reference observations can contain errors, their quality and uncertainty should be documented.
Training data should not be treated as an independent measure of generalization. A separate validation dataset—and, where appropriate, separate geographic sites or survey dates—provides a more meaningful test of performance under new conditions.
There is no universal minimum that suits every project. Sample requirements depend on the number and prevalence of vegetation classes, the sampling design, the desired statistical precision, and the decisions the map will support.
When a target species is uncommon, correct predictions for widespread non-target classes can dominate the overall accuracy score. Class-specific recall, precision, and error patterns are needed to understand whether the map reliably identifies the target species.
Precision measures how often predicted target-plant detections are correct. Recall measures how many reference-confirmed target-plant occurrences were successfully detected. Both are useful because false positives and false negatives have different operational consequences.
Drone imagery can extend the spatial coverage of vegetation observations, but field surveys remain important for reference labeling, ecological interpretation, and verification. The appropriate combination depends on the project.
For a broader comparison, read AI vs. Field Surveys for Invasive Plant Detection: Accuracy and Cost.
A useful AI-generated wetland vegetation map needs more than a convincing visual appearance or a high headline accuracy score.
Reliable assessment begins with a clear monitoring objective, independent reference observations, and a sampling design that represents the study area. It continues with class-specific error analysis, investigation of wetland-specific challenges, and a decision about whether the map is suitable for its intended use.
By treating ground truthing as a repeatable part of vegetation monitoring, conservation teams can make better-informed use of AI detection results while recognizing where additional field verification is still needed.

Autonomous vehicles generate terabytes of sensor data daily from cameras, LiDAR, radar, and GPS systems, yet raw data alone cannot teach mac

The human vision includes our eyes, abstract fundamental understanding, and unique experiences gained from our numerous contacts with the ou

Data augmentation in deep learning involves artificially enhancing training data sets by applying random transformations and biases to gener

Image classification refers to the task of categorizing visual images into one of several predefined classes based on their contents and fea

The challenges and limits of today's technology, working circumstances, and other factors all significantly affect the quality of final prod

Image Deblurring refers to recovering a sharp image from the input blurred one. It is inherently an ill-posed problem that has been studied
Be the first to share your thoughts
Start the conversation by sharing your thoughts
Share this article
Help others discover this content
Get expert insights, product news, and industry trends delivered straight to your inbox.
No spam, unsubscribe anytime. We respect your privacy.