



Reducing Misclassification in AI Invasive Species Detection
Learn how better seasonal imagery, spatial metrics, and Sairone reduce misclassification in AI invasive-species detection
Written by Amirhossein
Reviewed by Boshra

Misclassification can undermine an invasive-species monitoring program even when a model reports strong aggregate accuracy. A false positive may direct field crews toward non-target vegetation, while a false negative can leave an emerging population undetected. The underlying causes are diverse: ambiguous labels, seasonal appearance changes, illumination artifacts, limited training examples, class imbalance, and poor localization.
This article presents a source-grounded framework for reducing those errors. It examines annotation quality, precision and recall, spatial evaluation, satellite time series, drone-imaging conditions, active learning, and geospatial deployment. It also explains how Sairone can connect AI-based plant identification with human validation, GIS outputs, treatment zones, and customized enterprise workflows.
Ground Truth and Label Quality
Human Annotation Limits in Field Imagery
The quality of an invasive-species detector depends heavily on the quality of the labels used to train and evaluate it. Annotation is not merely a mechanical process of drawing boxes or polygons. It requires a reliable decision about whether the visible organism belongs to the target class, especially when the target resembles surrounding vegetation or appears only partially in an image.
This difficulty is evident in aquatic invasive-species recognition. Dreissenid invasive and non-invasive larvae can have subtle visual differences, making them challenging for human annotators without experience in larval-image interpretation. The cost of creating labeled datasets is therefore high because annotation requires specialist knowledge, not simply access to image files.
Plant imagery presents a comparable problem. Citizen-science programs can collect images across broad areas, but non-specialists may find species-level identification difficult. Although digital cameras, smartphones, and online platforms make image collection easier, organizing large volumes of observations and maintaining identification accuracy remain significant challenges.
Reducing Ambiguity with Better Samples
A training dataset should represent the visual variability that the deployed model will encounter. False negatives commonly occur when a target is viewed from an angle, under lighting conditions, or in a visual state that the model did not see during training. Expanding the representation of those conditions can reduce missed detections. False positives, meanwhile, often occur when non-target objects resemble the target; explicitly labeling confusing examples can help the model separate them.
Phenological timing can improve sample quality. Invasive plants may become easier to distinguish during flowering or autumn, and flowers can provide more recognizable color and shape cues than leaves or stems. Sampling should therefore include relevant seasonal stages rather than treating all images as visually interchangeable.
Annotation systems should also preserve the distinctions required by the application. ArcGIS Pro’s deep-learning workflow supports labeled image collections, predefined classification schemas, bounding-box exports, and output fields such as class label and inference confidence. Sairone similarly provides tagging and annotation capabilities, including polygon and bounding-box annotation, multiple classes, class management, custom colors, and precision drawing. These tools support consistent class definitions and make it possible to correct ambiguous predictions through a human-in-the-loop review process.
Precision, Recall, and Error Tradeoffs
False Positives Versus Missed Detections
Precision and recall describe different failure modes. Precision measures how many positive predictions are correct:
[ \text{Precision}=\frac{TP}{TP+FP} ]
Recall measures how many actual target instances the model finds:
[ \text{Recall}=\frac{TP}{TP+FN} ]
In these formulas, (TP) represents true positives, (FP) false positives, and (FN) false negatives.
A model with low precision produces too many false alarms. In invasive-species mapping, those alarms may increase the number of sites that require inspection or treatment verification. A model with low recall misses real plants or populations. That failure can be more serious when the monitoring objective is early discovery or rapid response.
The preferred balance depends on the operational cost of each error. Roboflow’s discussion of precision and recall describes high-precision use cases in which false detections trigger unnecessary actions, as well as high-recall situations in which a missed detection carries much greater consequences. The same logic applies to invasive-plant monitoring: model thresholds should reflect whether the system is screening broadly, prioritizing field inspection, generating treatment zones, or supporting a final management decision.
Choosing Metrics for Invasive Species Workflows
Object detection must evaluate both classification and localization. The model needs to identify the correct species and place the detection in the correct image position. Useful metrics therefore include precision, recall, F1 score, Intersection over Union (IoU), Average Precision (AP), and mean Average Precision (mAP).
IoU measures the overlap between a predicted bounding box and the reference box. Low IoU can indicate that the model recognized the target but localized it inaccurately. The mAP@50:95 metric evaluates performance over multiple IoU thresholds and is more demanding than measuring mAP at a single threshold.
A 2024 invasive-alien-plant study demonstrates why multiple metrics should be reported together. The improved YOLOv9-based YOLO-IAPs model achieved 90.7% precision, 84.3% recall, 91.2% mAP50, 65.1% mAP50:95, and a detection speed of 72 frames per second. Relative to its baseline, precision improved by 0.2 percentage points, recall by 3.5 points, and mAP50 by 1.0 point. These values describe distinct aspects of performance. Precision alone would not show how many plants were missed, and recall alone would not reveal the rate of false alarms.
Spatial Context in Model Evaluation
Localization Quality and Object Overlap
Misclassification is often discussed as though it were limited to the wrong class label. In geospatial detection, location is equally important. A prediction can identify a plant as an invasive species but still be operationally weak if the bounding box is displaced, excessively large, or too small.
Drone-based workflows may require transformations between pixel space and map space. Esri describes a process in which a model detects objects in the pixel space of drone imagery and then transfers those geometries into map space using frame and camera information. Orthorectified image collections require camera characteristics such as focal length and other sensor information; GPS accuracy may also be included where available.
This transformation affects how predictions are interpreted in GIS. A correct species label attached to an inaccurate map location can misdirect field teams or distort the inferred extent of an infestation. Evaluation should therefore examine both class correctness and spatial alignment.
Why Detection Errors Cluster Near Targets
Spatial distribution can change the practical meaning of a false positive. In a satellite-based study of leafy spurge (Euphorbia virgata), most false-positive errors occurred close to true populations. The researchers reported that these errors were not consequential for management because they remained near genuine target populations.
This finding supports a more detailed error-analysis process. A false positive adjacent to a confirmed infestation may represent a boundary error or a visually similar plant within the same management area. A false positive far from any known population may require a different response because it creates an isolated investigation site.
Spatial evaluation should therefore include mapped error locations, distance to confirmed populations, and the relationship between predictions and management boundaries. These analyses can reveal whether a model is generating random misclassification or consistently expanding the edges of real infestations.
Satellite Time Series for Species Discrimination
Seasonal Signals for Model Separation
Satellite imagery presents a tradeoff between spatial detail, spectral information, and acquisition frequency. WorldView-2 imagery provided high spatial and spectral resolution in a leafy-spurge detection study, but images were not routinely collected across space and time. PlanetScope imagery offered lower spatial and spectral resolution but daily coverage across Earth.
A CNN using WorldView-2 imagery achieved 96.1% accuracy, while the PlanetScope CNN achieved 89.9%. The researchers then added a long short-term memory layer to the PlanetScope model so it could use phenological information from a time series. Accuracy increased to 96.3%, approximately matching the WorldView-2 model.
The timing of observations mattered. Early- and mid-season phenological periods were important for predicting leafy spurge, and green, red-edge, and near-infrared bands helped distinguish it from other vegetation. These findings show that misclassification can arise when a model is forced to interpret a species from a single seasonal appearance that overlaps with non-target vegetation.
Combining Spatial and Temporal Cues
A time series gives the model more than repeated images. It provides information about how the target changes relative to its surroundings. A species that is difficult to distinguish in one image may exhibit a different seasonal trajectory from neighboring plants.
This is particularly useful when frequent imagery has lower spatial or spectral resolution. The PlanetScope LSTM result demonstrates that temporal information can improve species separation without relying exclusively on the highest-resolution imagery. However, the useful signal is not necessarily uniform across the year. Acquisition schedules should include periods that provide meaningful contrast between invasive plants and background vegetation.
Seasonal timing also matters for image-based field collection. Flowering and fall can make alien plants more visually distinctive in photographs, while flowers may provide stronger recognition cues than vegetative structures. Combining satellite time series with appropriately timed drone or ground imagery can give annotation and model evaluation a more representative view of seasonal appearance.
Drone Imagery and Object Detection Pipelines
Image Quality, Illumination, and Model Size
Drone surveys provide detailed imagery but can expose models to strong changes in illumination and exposure. A study of Siam weed (Chromolaena odorata) used RGB drone images from four sites in Queensland to train and test a YOLOv5 detector. The initial F1 score exceeded 0.85 and improved to more than 0.95 after the model received better exposure to the image conditions.
The study linked many false positives to foliage and bark under high solar illumination. Lower-exposure images reduced these errors considerably. Increasing model complexity did not substantially improve performance, indicating that a smaller model was sufficient for the task.
These results point to a practical misclassification-control strategy: improve the diversity and quality of the imagery before assuming that a more complex architecture is required. Image exposure, solar conditions, and representative field examples can directly influence whether the model confuses background vegetation with the target species.
Training Data Volume and Detection Speed
The Siam-weed model was considered reliably trained with approximately 1,000 image tiles. Additional images produced only marginal improvement. This does not mean that more imagery is unnecessary. It indicates that after sufficient coverage is reached, the composition of the dataset may matter more than its raw size. Difficult illumination conditions, seasonal stages, and confusing non-target vegetation should receive deliberate attention.
Processing capacity also affects whether a detector can support large-area monitoring. In a Santa Ana River watershed assessment for Arundo donax, the project used more than 8,500 tiled GeoTIFFs of three-inch-resolution, four-band aerial imagery collected in 2020 and 2021. Upgrading the hardware reduced a process estimated at 10–12 hours to approximately one to two hours.
The same project divided the analysis into smaller areas of interest based on location, similar ground conditions, and similar imagery-collection dates. This grouping reflected the fact that Arundo could appear differently according to lighting, atmospheric conditions, ground conditions, and the amount of water in the vegetation. Segmenting the workflow by comparable conditions can reduce variation that otherwise contributes to inconsistent classification.
Active Learning for Scarce Invasive Data
Contrastive Representations for Sample Selection
Invasive-species datasets often contain too few positive examples for conventional supervised learning. Active learning addresses this limitation by selecting informative samples for iterative labeling rather than labeling a large dataset indiscriminately.
A study of invasive dreissenid larvae combined supervised contrastive learning with k-means clustering. Contrastive learning projected the data into a smaller and more discriminative representation, allowing clustering to identify informative samples for annotation. This approach focuses expert effort on examples that may clarify class boundaries or improve generalization.
The reported low-budget experiment began with 100 samples. After 100 additional active-learning samples, the method reached 78% balanced accuracy, which was 27 percentage points higher than random sampling and 22 points higher than a core-set approach. The result supports active learning as a way to improve data efficiency when expert labels are expensive.
Managing Imbalance in Rare-Species Datasets
Rare invasive species create a severe class-imbalance problem. In early invasion stages, target organisms may be uncommon relative to non-invasive species. The aquatic-larvae study also identifies seasonal variation as an additional source of difficulty.
Evaluation and sample selection should account for that imbalance. Balanced accuracy can provide a more informative view than a metric dominated by the majority class. Active-learning cycles can then target rare positives, visually ambiguous examples, and hard negatives that resemble invasive plants.
A controlled review process is especially valuable after inference. Sairone allows users to inspect, revise, and confirm AI identifications, while its annotation features support multiple classes and precise polygon or bounding-box labeling. That human feedback can improve the consistency of future training data and reduce recurring confusion between target and non-target vegetation.

Sairone and its Field Application in AI-Driven Precision Agriculture
Cloud Processing for Large Geospatial Imagery
Sairone is Saiwa’s B2B SaaS platform for agricultural service providers, agronomists, cooperatives, and ecologists. Its stated applications include weed and invasive-plant control, crop-yield estimation, wildlife protection, and crop-health monitoring. The platform accepts images, videos, and orthomosaics, and can generate an orthomosaic from video input.
For weed-control projects, documented inputs include drone imagery at different heights and resolutions, geometrically corrected orthophotos, georeferenced GeoTIFFs, and batch uploads for large-scale analysis. TIFF, JPEG, and PNG formats are supported. Cloud processing provides scalable infrastructure and connection with geographic coordinate systems, while users can upload data through the online platform for processing and reporting.
The platform’s file environment supports cloud storage, folders, multiple formats, and large files. GeoTIFF processing automatically extracts spatial metadata and preserves the coordinate reference system, helping make outputs suitable for GIS workflows and georeferencing in Atlas. This architecture reduces the need for customers to build and maintain their own image-processing infrastructure.
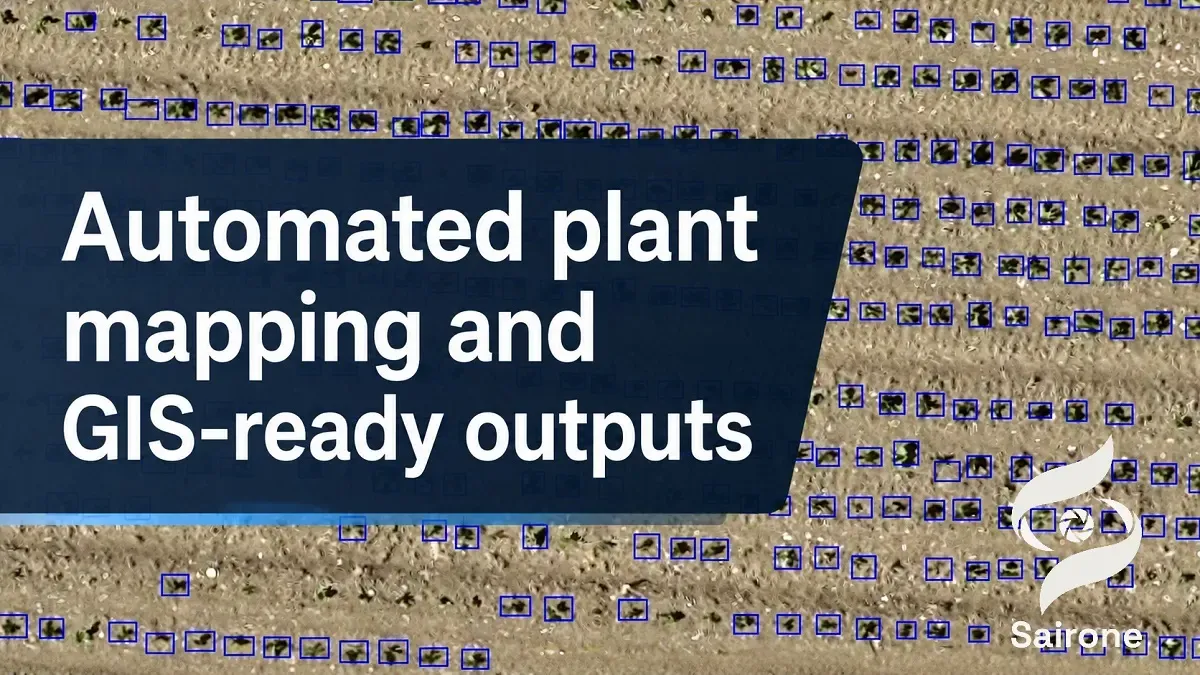
Automated Plant and Invasive Species Mapping
Sairone’s Weed and Invasive Plant Control service uses computer vision and machine learning to identify, map, and analyze weeds and invasive plants in farms and natural environments. Documented supported species include Taraxacum or dandelion, Amaranthus tuberculatus or waterhemp, Amaranthus palmeri or Palmer amaranth, European water chestnut, water soldier, fleabane, and thistle.
The system provides confidence scores and geographic coordinates with its results. Users can validate detections through a human-in-the-loop workflow, correcting or confirming the model’s output before it is transferred into Atlas. This review layer is directly relevant to misclassification control because it keeps automated detection connected to expert inspection.
Atlas displays validated detections over high-resolution aerial and satellite imagery. It supports distribution visualization, infestation-pattern analysis, treatment-map creation, custom zones, hierarchical field segmentation, and intelligent detection clustering. The clustering process groups identified weeds into manageable treatment zones for spraying operations.
GIS-Ready Outputs for Field Operations
Sairone provides GIS-ready outputs in GeoJSON, Shapefile, KML, and CSV formats. These formats allow detection results to be incorporated into mapping, reporting, and field-management workflows.
The platform’s documented functionality supports treatment zones and optimized spraying operations. It does not require the model output to remain as an unstructured list of detections. Instead, validated spatial results can be organized into zones that represent practical management areas. This distinction is important when the objective is to reduce the operational impact of misclassification: field teams can review spatial patterns and treatment boundaries rather than acting on isolated model predictions alone.
Custom Enterprise Deployment and Integrations
Saiwa develops and customizes AI models according to the customer’s audience, data, and agricultural or environmental requirements. Sairone therefore supports specialized plant-detection models rather than limiting every organization to one fixed detection template.
The service can be delivered through the cloud-based Sairone platform, custom APIs added to an existing client infrastructure, or a fully customized White Label platform aligned with the customer’s brand and workflow. Its multi-tenant architecture also supports BaaS services for agritech companies.
Sairone’s dashboard includes processing-time analytics, service-usage information, recent files, processing jobs, annotation projects, storage use, license and credit status, weather information, and interactive Atlas visualizations. Together, these capabilities provide a framework for connecting model outputs, review activity, geospatial analysis, and enterprise reporting within a single operational environment.
Conclusion
Reducing misclassification in invasive-species detection requires coordinated control of the entire pipeline. High-quality labels, representative seasonal and illumination conditions, explicit precision-recall decisions, spatial error analysis, and imbalance-aware sampling all contribute to more dependable model behavior. The evidence shows that temporal information can raise satellite-model accuracy, improved exposure can reduce drone-image false positives, and active learning can improve balanced accuracy when labeled invasive examples are scarce.
The final objective is operational reliability. A detector must identify the correct species, place it accurately, expose its confidence and error patterns, and deliver results in a form that supports field decisions. Sairone extends this workflow through human validation, spatial visualization, treatment-zone clustering, GIS-compatible exports, and customized deployment options for agricultural and environmental organizations.
About the team
Comments
Be the first to share your thoughts
No comments yet
Start the conversation by sharing your thoughts
Share this article
Help others discover this content
Table of Contents
No headings were found on this page.