



Mapping Submerged and Floating Invasive Plants with UAV Imagery
UAV imagery for aquatic plant monitoring enables precise species mapping, cover estimation, and rapid AI-driven detection with centimeter-scale orthomosaics
Written by Amirhossein
Reviewed by Boshra
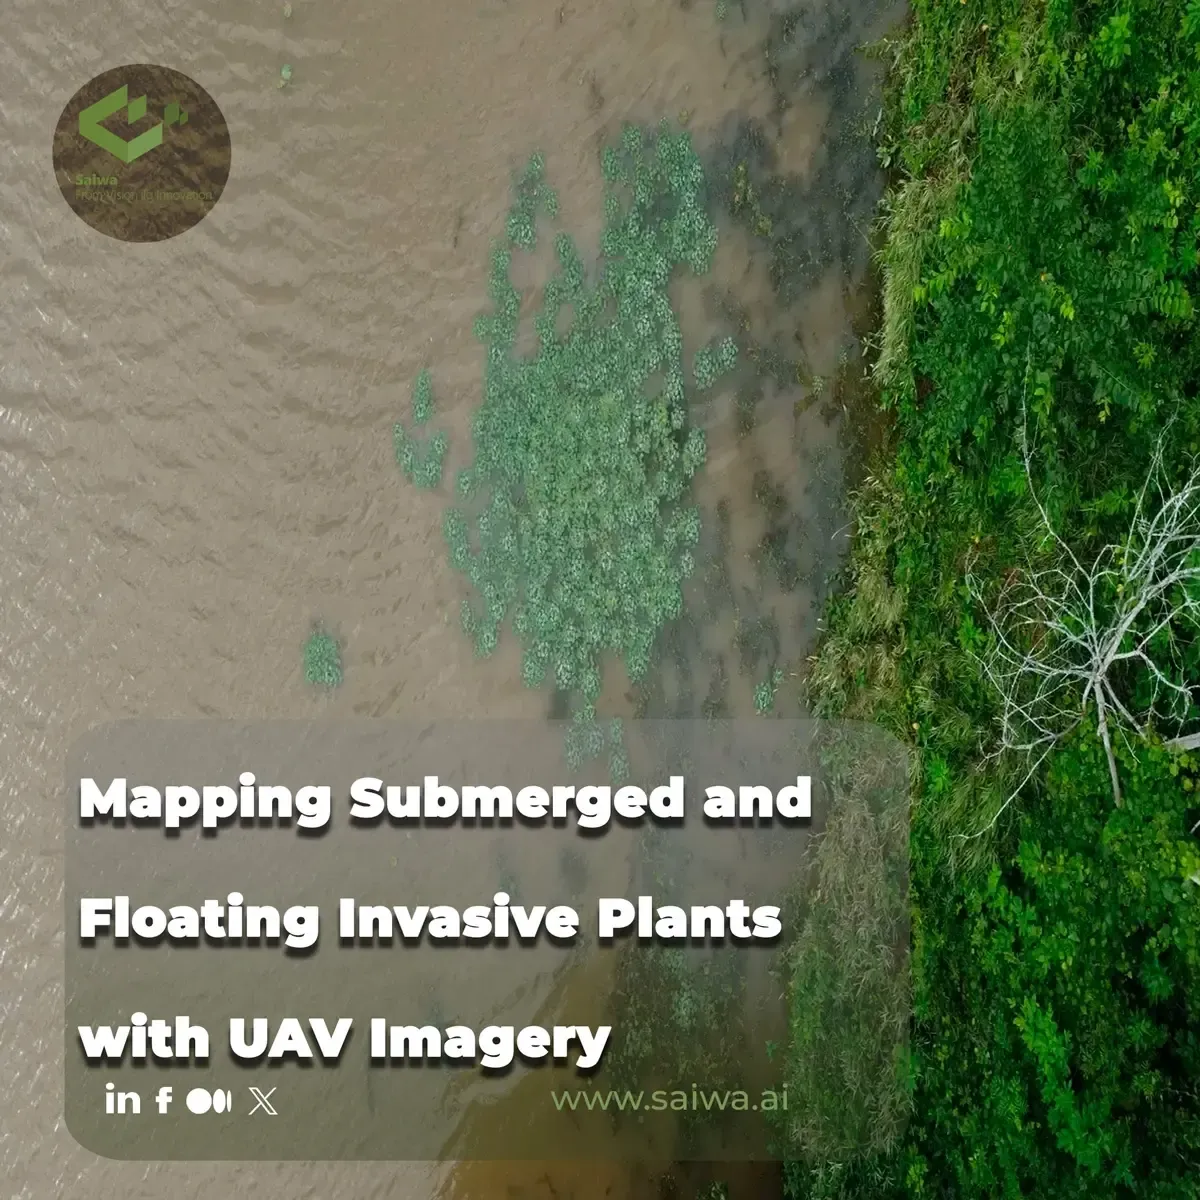
UAV Imagery for Aquatic Plant Monitoring
Unmanned Aerial Vehicles (UAVs) have established themselves as essential platforms for capturing high-resolution geospatial data across complex wetland and freshwater ecosystems. Traditional monitoring methods, which often rely on field surveys conducted from boats or broad-scale satellite imagery, struggle to provide the spatial resolution and rapid deployment necessary to track aggressive aquatic invaders. UAV technology bridges this gap by enabling ecologists and water resource managers to deploy agile sensor payloads over difficult-to-navigate water bodies, capturing real-time or near-real-time data on plant distribution and health.
The integration of UAVs into aquatic plant management workflows allows for highly targeted interventions. Instead of applying broadcast treatments across entire water bodies, management teams can utilize aerial data to pinpoint the exact locations of invasive populations. This precision minimizes the chemical load introduced into sensitive aquatic environments, reduces operational costs, and mitigates unintended impacts on native flora. The capacity to frequently revisit sites also provides an objective mechanism for evaluating the efficacy of applied control measures over successive growing seasons.
Centimeter-Scale Orthomosaics for Detecting Aquatic Vegetation Patterns
The foundational output of UAV-based aquatic monitoring is the generation of centimeter-scale orthomosaics. By capturing hundreds or thousands of overlapping aerial photographs, photogrammetric software stitches these images into continuous, geometrically corrected maps. This extreme level of detail, often achieving a ground sample distance (GSD) of less than 5 centimeters per pixel, reveals fine-scale spatial patterns that remain invisible to conventional satellite sensors.
At this resolution, analysts can distinguish individual plant clusters, assess canopy texture, and detect the preliminary establishment of invasive colonies before they form dense, problematic mats. Furthermore, the temporal flexibility of drone deployments allows operators to capture these orthomosaics under optimal lighting and wind conditions, minimizing water surface glare and wave action that historically degrade aerial observations of aquatic environments.
Species-Level Mapping and Cover Estimation in Aquatic Systems
Achieving species-level identification in aquatic environments requires transitioning from broad habitat classification to granular, taxa-specific mapping. UAV imagery facilitates this by capturing morphological and structural variations among different plant communities. The high spatial fidelity of drone data enables the differentiation between submerged species, floating-leaved vegetation, and emergent boundary plants, which is critical for calculating precise biovolume and spatial distribution metrics.
By establishing accurate baselines of species distribution, researchers can model the expansion trajectories of invasive plants against native competitors. This quantitative approach shifts aquatic vegetation management from qualitative, localized observations to rigorous, data-driven spatial analysis.
Visual Interpretation of Vegetation Stands and Species Patches
Visual interpretation remains a robust preliminary method for assessing UAV orthomosaics. Expert analysts can leverage the extreme spatial resolution to manually delineate distinct vegetation stands based on shape, color, and structural texture. For instance, the uniform, dense canopy of invasive floating species often contrasts sharply with the fragmented, multi-tiered structure of native submerged and emergent plant complexes.
While manual digitization is time-intensive, it provides highly reliable ground-truth datasets necessary for training automated classification algorithms. Analysts can identify subtle morphological features, such as distinct leaf arrangements or the presence of floating rosettes, which characterize specific invasive targets during peak growth phases. This human-in-the-loop interpretation is particularly valuable when dealing with mixed-species patches where algorithmic separation might initially struggle due to spectral blending.
Estimating Plant Cover and Spatial Extent from UAV Imagery
Accurate estimation of plant cover is a critical metric for regulatory compliance and ecological assessment. UAV orthomosaics allow for the direct calculation of total surface area occupied by invasive species within a defined study site. By establishing precise vector polygons around identified patches, managers can extract exact square meterage and calculate the percentage of total water surface affected.
This quantitative spatial extent data directly informs resource allocation for management interventions. Whether determining the necessary volume of targeted herbicides, planning mechanical harvesting routes, or scheduling biological control releases, accurate cover estimations ensure that responses are proportional to the invasion's scale. Furthermore, sequential flights over the same geographic coordinates enable longitudinal studies, tracking the expansion or contraction of plant cover dynamically over time.

Spectral Inputs and Feature Selection for Aquatic Plant Discrimination
The accurate classification of aquatic plant species heavily depends on the quality and dimensionality of the spectral data captured by the UAV sensors. Different plant species possess distinct biochemical compositions and physical structures, which dictate how they reflect and absorb solar radiation across various wavelengths. Selecting the optimal spectral inputs and mathematically transforming them to highlight subtle differences is crucial for maximizing algorithmic classification accuracy.
Multispectral Bands, Spectral Indices, and PCA in UAV Workflows
UAVs equipped with multispectral sensors capture data beyond the visible spectrum, specifically in the Near-Infrared (NIR) and Red-Edge bands, which are highly sensitive to vegetation health and internal leaf structure. Analysts frequently combine these raw bands into mathematical spectral indices, such as the Normalized Difference Vegetation Index (NDVI = (NIR − Red) / (NIR + Red)) or the Green Normalized Difference Vegetation Index (GNDVI), to amplify the vegetation signal against background water noise.
To manage the high dimensionality of incorporating numerous raw bands and derived indices, researchers often apply Principal Component Analysis (PCA). PCA is a statistical technique that transforms correlated variables into a smaller number of uncorrelated principal components. In aquatic mapping workflows, PCA effectively isolates the most significant variance in the multispectral dataset, reducing computational load for classifiers while maintaining the critical spectral signatures necessary for species discrimination.
When Original Spectral Bands Are Sufficient for Class Separation
Despite the availability of complex spectral transformations, research indicates that raw spectral bands are sometimes entirely sufficient for accurately separating certain aquatic plant classes. If the target invasive species exhibits a highly distinct spectral signature — perhaps due to unique pigmentation or an emergent canopy structure that heavily reflects NIR radiation — the addition of derived indices or PCA transformations may yield negligible improvements in classification accuracy.
In operational scenarios constrained by processing time or computational power, utilizing a lean stack of original Red, Green, Blue, and NIR bands can be highly efficient. Algorithms like Random Forest possess inherent feature selection capabilities, allowing them to naturally identify and rely upon the most discriminative raw bands without requiring extensive pre-processing of the input data. This streamlined approach proves particularly viable when mapping monospecific stands of highly visually distinct invasive species.
Phenology-Aware Mapping of Aquatic Invasive Plants
Vegetation mapping is not a static endeavor; plant reflectance and physical structure change dynamically throughout their life cycles. Phenology — the study of cyclic and seasonal natural phenomena, especially in relation to climate and plant life — plays a decisive role in remote sensing. Understanding the temporal growth patterns of target invasive species is essential for timing UAV flights to capture maximum spectral or morphological distinctiveness.
Using Phenological Differences to Improve Invasive Plant Detection
Invasive aquatic plants often exhibit phenological timelines that differ significantly from native species. They may emerge earlier in the spring, sustain peak biomass longer into the autumn, or flower at distinct intervals. By scheduling UAV surveys to coincide with these precise phenological windows, managers can exploit these temporal differences to isolate the target species.
For example, capturing imagery when a specific invasive plant is uniquely in its flowering stage introduces highly distinct color variables (e.g., bright yellow or white blooms) into the spectral dataset. These distinct floral signatures serve as powerful classification features for machine learning algorithms, dramatically increasing detection rates and reducing false positives that might occur if the survey were conducted during a period of uniform green vegetative growth.
Managing Confusion Between Spectrally Similar Aquatic Plant Classes
A primary challenge in mapping aquatic ecosystems is resolving confusion between distinct species that possess nearly identical spectral signatures during specific growth phases. Submerged vegetation, in particular, suffers from signal attenuation through the water column, which homogenizes reflectance profiles and complicates algorithmic separation.
To manage this spectral confusion, analysts must integrate secondary data layers alongside standard multispectral imagery. Incorporating high-resolution digital surface models (DSMs) derived from photogrammetry allows classifiers to utilize plant height or canopy texture as differentiating variables. Furthermore, applying multi-temporal classification strategies — analyzing stacked imagery from multiple dates across the growing season — enables algorithms to track phenological changes over time, separating species based on their distinct growth trajectories rather than relying solely on a single, ambiguous spectral snapshot.
Accuracy Assessment and Operational Constraints in Real-World Surveys
The generation of a classification map is incomplete without a rigorous statistical evaluation of its reliability. In academic and applied remote sensing, accuracy assessment ensures that the derived spatial data provides a trustworthy foundation for physical management actions. However, translating theoretical methodologies into real-world wetland environments exposes numerous operational constraints that can degrade data quality.
Interpreting Overall, Producer's, and User's Accuracy in Aquatic Vegetation Maps
Accuracy in remote sensing is typically evaluated using a confusion matrix, which compares the classified map against independent ground-truth data points. Overall accuracy provides a broad metric of general performance, but it can obscure class-specific errors. Therefore, it is critical to interpret both Producer's Accuracy (errors of omission) and User's Accuracy (errors of commission).
Producer's Accuracy indicates the probability that a specific plant species on the ground was correctly classified on the map, highlighting instances where the algorithm missed the target. Conversely, User's Accuracy reflects the reliability of the map from the perspective of a field manager — indicating the probability that a pixel labeled as an invasive species actually corresponds to that species in reality. High User's Accuracy is particularly critical in targeted eradication programs to ensure that expensive or ecologically aggressive treatments are not erroneously applied to native habitats.
Environmental, Processing, and Depth-Related Mapping Challenges
Real-world UAV surveys of aquatic systems face persistent environmental challenges. Solar glare off the water surface, wind-induced wave action, and variable cloud cover can introduce severe radiometric inconsistencies across an orthomosaic, confusing machine learning classifiers. Submerged plants present an even greater challenge due to the physics of light attenuation; the water column absorbs and scatters spectral signals, particularly in the critical NIR band, effectively blinding standard multispectral sensors at depths greater than a few meters.
Furthermore, the processing side of UAV photogrammetry requires substantial computational infrastructure. Generating ultra-high-resolution orthomosaics and executing deep learning classifications over vast wetland areas generates massive datasets. The time required to stitch imagery, orthorectify the outputs, and execute complex OBIA workflows can delay the delivery of actionable data to field teams, limiting the true "near-real-time" potential of UAV technology if processing pipelines are not highly optimized.
Sairone and its Field Application in AI-Driven Precision Agriculture
Scaling Remote Sensing Data through Cloud Intelligence
Sairone is an advanced, AI-driven platform developed by Saiwa, engineered specifically to manage and process the massive datasets inherent to modern precision agriculture. Sairone functions as a centralized intelligence hub capable of seamlessly ingesting highly varied, high-resolution imagery. It supports inputs from diverse aerial platforms, including standard quadcopter drones, fixed-wing systems, expansive satellite networks, and localized machine-mounted camera arrays on tractors. This multi-sensor compatibility ensures comprehensive spatial coverage across all operational scales.
A core operational advantage of Sairone is its sophisticated cloud architecture, designed to eliminate local hardware bottlenecks. The platform can effortlessly handle the direct upload and processing of massive "mega files," such as multi-gigabyte, high-density TIFF orthomosaics. Crucially, Sairone processes these intensive spatial files natively in the cloud without requiring any localized data reduction or down-sampling. This ensures that the ultimate centimeter-level accuracy captured by the UAV hardware is fully preserved for downstream algorithmic analysis.
Automated Species Identification and Density Mapping
Sairone's "Weed and Invasive Plant Control" service represents a highly specialized application of computer vision within agronomy. Utilizing proprietary neural networks, the platform moves beyond simple biomass detection to achieve definitive, automated species identification. It is specifically trained to recognize and isolate problematic agricultural weeds, reliably identifying specific biological targets such as Taraxacum officinale (dandelion), Amaranthus albus (tumble pigweed), fleabane, and various thistle varieties across highly heterogeneous field conditions.
Once the targeted species are identified within the orthomosaic, Sairone immediately generates exact spatial density maps. Instead of providing binary presence/absence indicators, the platform quantifies the severity of the infestation, calculating the concentration of invasive plants per square meter. This high-fidelity density mapping provides farm managers with a localized, quantifiable understanding of weed pressure, establishing the essential data foundation necessary for precise, variable-rate chemical application or mechanical intervention.
Translating Spatial Insights into Variable-Rate Field Action
The true utility of agronomic AI lies in its ability to translate raw analytical data into actionable field operations. Sairone accomplishes this by outputting its density maps and weed locations as standardized, GIS-based visualization layers. Users can export their processed data as Shapefiles, GeoJSON, CSV, or KML formats. This interoperability ensures that Sairone's insights can be ingested directly by the onboard computers of modern smart sprayers and variable-rate application (VRA) machinery.
To further streamline agronomic planning, Sairone features a proprietary auto-clustering algorithm. Rather than providing operators with scattered, disorganized weed points, the algorithm automatically groups affected field sections into localized, logical management blocks. This clustering occurs rapidly — often within hours of the initial data upload. By automating the creation of these clean, spatially optimized management zones, Sairone drastically reduces the manual agronomic planning time required before deploying field machinery.
Custom AI Infrastructure and Enterprise B2B Customization
Recognizing that rigid, one-size-fits-all software templates frequently fail in complex agricultural environments, Sairone is built with a focus on deep enterprise integration. The platform offers customized plant detection models tailored specifically to a client's unique regional flora or specific crop-weed dynamics. This ensures that the underlying AI is perfectly calibrated to the specific operational realities of the end-user, rather than relying on generalized agricultural datasets.
Furthermore, Sairone provides extensive Enterprise B2B customization aimed at seamless corporate integration. Clients can leverage tailored reporting dashboards to track specific KPIs, deploy full white label options to present the technology under their own corporate branding, and utilize flexible Back-end as a Service (BaaS) APIs. These APIs allow large-scale agricultural enterprises and agronomy firms to integrate Sairone's powerful processing and identification engines directly into their pre-existing proprietary software architectures, aligning the AI perfectly with their broader operational goals.
References (3)
Comments
No comments yet!
Table of Contents
No headings were found on this page.