Evaluating the ROI of Green-on-Brown Spot Spraying for Post-Harvest Weed Control
Oct 5, 2026
Written by: Amirhossein Komeili
Reviewed by: Boshra Rajaei, PhD
Written by: Amirhossein Komeili
Reviewed by: Boshra Rajaei, PhD
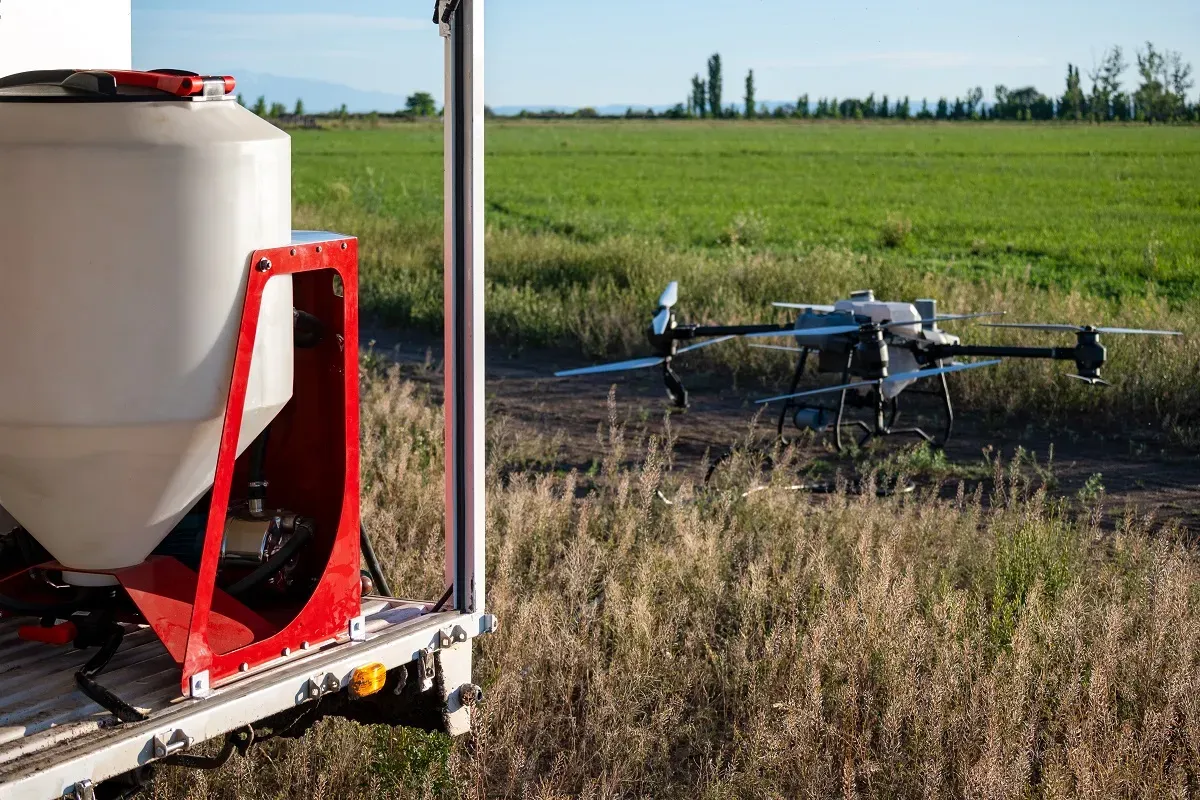
Post-harvest fields often show an uneven weed pattern: a few dense patches, thin linear infestations, and large areas with little green vegetation. A broadcast pass treats all of them alike. Green-on-brown spot spraying changes that premise by detecting weeds against bare soil, residue, or fallow background and activating spray only where targets are found.
That does not make targeted spraying automatically profitable. Its return depends on weed coverage, herbicide price, application frequency, equipment ownership, algorithm fees, detection sensitivity, spray coverage, and the cost of weeds that are missed. The most useful ROI calculation weighs savings from unsprayed ground against the cost of technology and the agronomic consequences of lower control reliability.
Fallow and post-harvest fields are often managed with blanket herbicide applications because the whole field is easy to treat operationally. Yet weed populations are commonly patchy rather than uniform. Treating only detected areas can reduce chemical use and off-target application, especially where weeds occupy a small share of the ground.
Herbicide-resistant weeds create a direct and longer-term cost pressure. Repeated herbicide use can select resistant individuals, which may then spread through seed, pollen, machinery, animals, or water. Resistance mechanisms include target-site mutation, enhanced metabolic detoxification, reduced herbicide uptake or translocation, and sequestration or compartmentalization.
Targeted application can reduce the herbicide volume applied to clean ground, but it must not be confused with a resistance solution by itself. WeedSmart places detection and spot spraying within an integrated weed-management approach designed to make each application effective and reduce resistance risk. The choice of active ingredient, use of effective rates, tank mixtures where appropriate, and control of surviving weeds remain central.
Broadcast spraying offers uniform coverage and a simple input calculation. Its limitation is that herbicide, water, travel, and potential crop exposure are applied over areas without detectable weeds. In the Montana fallow study, weeds occupied only a small proportion of broadcast treatment areas, indicating that a targeted system could have avoided substantial coverage of clean ground.
Broadcast remains a relevant benchmark, particularly where weed cover is broad, small targets are likely to be missed, or residual herbicide must be applied uniformly. The decision should compare a credible broadcast program with a credible targeted program. It should not compare a complete broadcast program with a targeted map that leaves a portion of the biological problem unmanaged.
Green-on-brown systems are designed for situations without a standing crop canopy. They detect green vegetation against non-green backgrounds such as bare soil, residue, or stubble. The ONE SMART SPRAY research identifies green-on-brown operation as suitable for burndown and pre-emergence applications because the system can identify green plants through infrared and near-infrared signals without separating crop from weed.
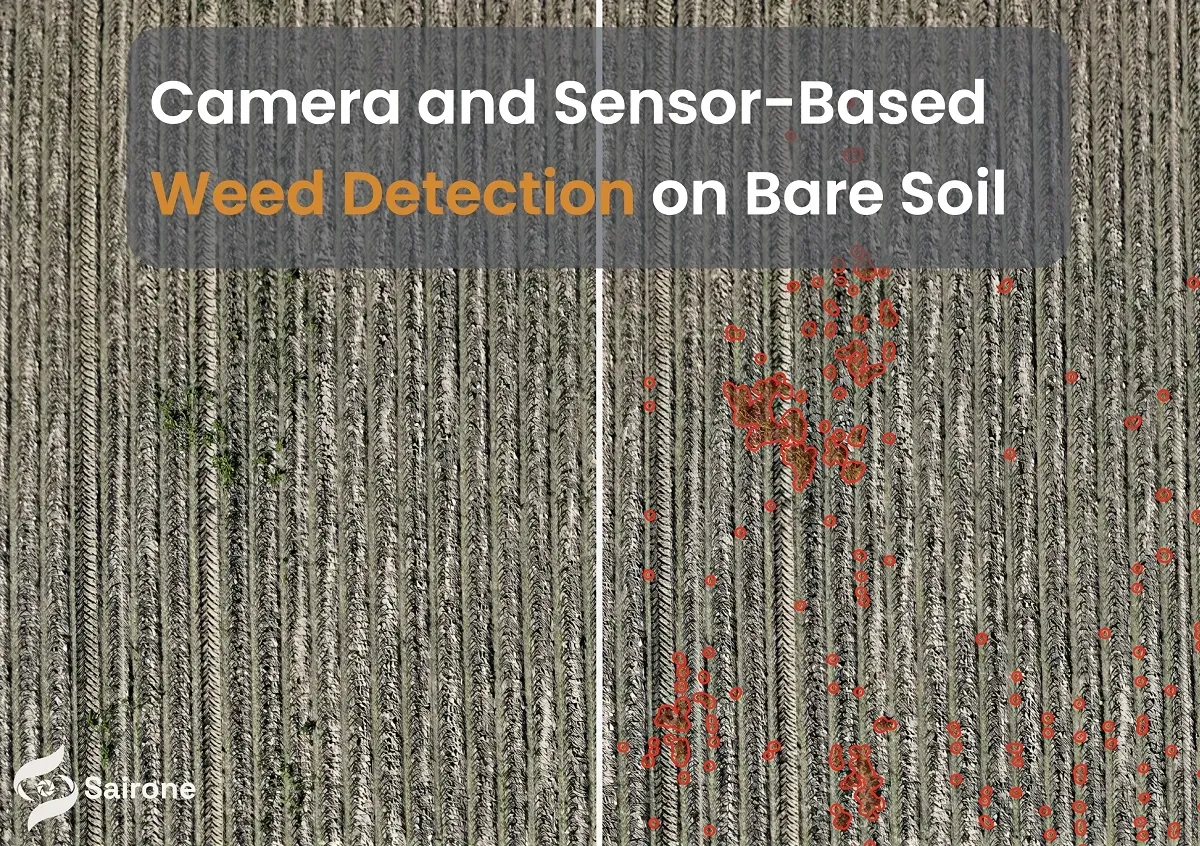
Different systems use different sensing approaches. The Montana SmartStriker X trial used RGB and hyperspectral cameras in green-on-brown mode for fallow weed detection. RGB provides standard colour data; hyperspectral imagery captures many narrow spectral bands and can detect more subtle differences between weeds and the background.
After detection, a precision sprayer needs to link the target location to nozzle activation. ONE SMART SPRAY recorded individual nozzle states, GPS coordinates, and as-applied points. Researchers then transformed these records into continuous treatment maps, using a 0.2 m × 0.2 m grid to calculate the final treated area. This kind of as-applied record is important for comparing a planned spot-spray program with what the machine actually delivered.
Sensitivity defines how small a target must be before the system activates a nozzle. In the Montana study, standard sensitivity targeted weeds as small as 2 in × 2 in, while high sensitivity targeted weeds as small as 0.3 in × 0.3 in. The expected trade-off is intuitive: higher sensitivity increases the chance of treating small weeds, but can increase treated area; lower sensitivity can lower herbicide use while increasing missed-target risk.
Results are not always linear. Montana researchers found no significant efficacy difference between high and standard sensitivity settings in their 2025 fallow study. In the three-year soybean study, however, the lowest sensitivity setting reduced the likelihood of treating small Amaranthaceae weeds between soybean rows from more than 99% under broadcast application to roughly 55% when weeds were 1.9 cm tall and 2.5 cm wide. Sensitivity should therefore be set according to target size, weed species, seed-production risk, and the potential cost of an escape.
Agronomic Insight: The least expensive spot-spray setting can produce the highest long-term cost when low sensitivity allows seed-producing or resistant weeds to escape. Treatment savings must be assessed beside the expected cost of misses.
Targeted-spray performance must be judged with two measures at once: how much product was avoided and how well weeds were controlled. Reduced sprayed area has value only when coverage, dose, and weed response remain sufficient for the management objective.
The 2025 Montana fallow trial recorded herbicide savings of 71% to 92% with spot spraying compared with conventional broadcast treatment. Savings remained 79% to 90% at the second application and 71% to 85% at the third, despite new mid-summer weed flushes. The reported total seasonal savings were US$43.50/ac under high sensitivity and US$45.50/ac under standard sensitivity.
The three-year soybean experiment reported a reduction in sprayed area of 20% to 90% for targeted programs relative to broadcast treatment. These outcomes demonstrate the importance of field weed coverage. A largely clean fallow field can create a large herbicide-use reduction, whereas widespread post-harvest regrowth will narrow the difference between targeted and broadcast costs.
| Trial or operational measure | Reported targeted-spray outcome | Citation |
|---|---|---|
| Montana fallow, 2025 | Herbicide savings of 71% to 92% across applications. | |
| Montana fallow, 2025 | Seasonal net savings: US$43.50/ac high sensitivity; US$45.50/ac standard sensitivity. | |
| See & Spray soybean, three years | Treated area reduced by 20% to 90% versus broadcast. | |
| See & Spray soybean, three years | Highest-sensitivity program: US$140.89/ha; broadcast: US$227.22/ha. |
In Montana, spot spray and broadcast treatments achieved similar weed-control efficacy. Weed coverage reduction was 18% to 46% after the first application, 68% to 83% after the second, and 78% to 88% after the third; travel speed of 5 versus 10 mph did not affect efficacy. Water-sensitive-paper assessments showed comparable coverage of weed surfaces under spot and broadcast application, ranging from 18.9% to 23%.
The ONE SMART SPRAY study found that targeted treatment at higher sensitivity was often comparable with broadcast treatment for reducing weedy area. Systems relying only on spot spraying, without broadcast residual herbicides, delivered less acceptable results in the study’s corn and soybean programs. Targeted foliar application and residual weed management therefore solve different parts of the seasonal problem.
ROI is driven by more than the hectares not sprayed. Fixed capital costs, interest, depreciation, repair, algorithm or subscription fees, fuel, labour, spray speed, boom width, chemical price, and the number of passes alter the result. A farm-specific calculation is more credible than an average benchmark because the same equipment can have very different ownership cost per hectare at different scales.
A simple spot-spray cost begins with the product cost multiplied by the proportion of the field sprayed. Sprayers 101 expresses gross spot-spray cost as (\text{pesticide price} \times \text{use rate} + \text{use fee}). With a US$4/ac broadcast herbicide cost, spraying 25% of the area costs US$1/ac in product. Adding a US$4/ac algorithm fee raises total cost to US$5/ac, making broadcast at US$4/ac cheaper in that example.
Weed cover changes the break-even point. If a field requires treatment over 50% of its area, the same US$4/ac product costs US$2/ac under a spot-spray application; after the US$4/ac fee, gross cost reaches US$6/ac. Low weed coverage and higher herbicide cost favour spot spraying, while increasing weed cover and lower herbicide cost make broadcast more competitive.
Algorithm fees can alter ROI materially. Sprayers 101 reports fees of US$3 to US$4/ac for some commercial systems, charged either by season or by each system use, while citing green-on-brown systems such as WeedIT and WeedSeeker as operating without these fees in the described period. Fee structure matters because an annual fee creates a different break-even result from a charge applied for each pass.
WeedSmart’s example assumes a US$250,000 capital cost for weed-detection technology and approximately US$35,000/year for ownership through interest and depreciation, depending on algorithm costs. Its 3,500 ha example requires the technology to replace one blanket spray, saving US$35,700/year in chemical cost. At 2,350 ha, the example requires replacement of 1.5 blanket sprays annually to save US$36,000.
Farm scale changes equipment economics. WeedSmart estimates that a new self-propelled boom spray with a US$1 million capital cost requires 4,900 ha or more to meet a US$10/ha ownership-and-operation target. A trailing boom, estimated at US$450,000 including half the tractor cost, is presented as viable at 2,000 ha. Its autonomous robot example has capital cost of about US$660,000 and remains below US$10/ha ownership cost at cropping areas of 4,000 ha or more.
Break-even also changes with missed-weed cost. Sprayers 101 models a US$4/ac algorithm fee and US$5/ac cost of a missed weed. In that example, the herbicide price needed for spot spraying to become more economical than broadcast rises above US$5/ac when fees are added and above US$14/ac when both algorithm and miss costs are included. These are scenario calculations, not universal thresholds; they show why a credible ROI model must price escapes and re-sprays rather than count only product saved.
Sairone provides a spatial workflow for agricultural service providers, agronomists, and cooperatives managing weed and vegetation information. Its Weed Control service applies AI, computer vision, machine learning, and geospatial analysis to detect, map, and analyse weeds and invasive plants from visual and georeferenced data. In a green-on-brown post-harvest workflow, it can support the evidence stage before an agronomist defines spray scope and ROI assumptions.
Sairone processes high-resolution drone imagery, satellite imagery, field images, orthophotos, videos, orthomosaics, and georeferenced datasets. Supported inputs include GeoTIFF, TIFF, JPEG, and PNG, and the platform can generate orthomosaics from video. Cloud file management supports uploaded imagery, inputs, outputs, folders, multiple file types, and large datasets.
Sairone Weed Control is designed to detect, map, and analyse weeds and invasive plants across agricultural fields and natural environments. Documented species include Taraxacum, Amaranthus tuberculatus, Amaranthus palmeri, European Water Chestnut, Water Soldier, Fleabane, and Thistle. Detections can carry confidence scores and precise geographic coordinates.
Users can review, correct, and approve AI-generated detections before final use. The approved results can then transfer to Atlas, Sairone’s geospatial environment for visualizing distributions, analysing infestation patterns, and generating treatment maps. This review process supports an ROI calculation based on approved weed-area information rather than an unverified imagery signal.
Sairone exports GIS-ready results in GeoJSON, Shapefile, KML, and CSV formats. These outputs can be transferred to geospatial and operational systems used for field planning and precision-spraying workflows. Atlas also includes detection-clustering algorithms that group identified weeds into manageable treatment zones.
For post-harvest spot spraying, a zone layer can be used to estimate affected area, compare patch treatment with broadcast coverage, and identify boundaries that warrant ground verification. Product label requirements, application settings, resistance risk, and the final spray decision remain agronomic responsibilities.
Saiwa develops or customizes AI models according to customer needs and available data. Its annotation tools support polygons, bounding boxes, class definitions, custom colours, and multi-class labelling, enabling structured dataset preparation and model refinement. The platform also provides dashboard functions for storage, service use, processing status, annotation projects, user-defined regions, and spatial visualizations.
Sairone is available through a cloud platform, customized API integration, and fully customized White Label delivery. API integration can connect detection and mapping services to existing client infrastructure, while White Label deployment can align with a client’s brand, workflow, and operational requirements. Saiwa also describes BaaS and a multi-tenant structure for agritech organizations.
The ROI workflow begins by measuring verified weed area, not assuming it. Sairone imagery processing, detection coordinates, validation, Atlas visualization, clustering, and GIS exports can produce the spatial variables required to compare targeted and broadcast treatment footprints. Those outputs can be joined with chemical price, planned rate, equipment costs, algorithm or subscription fees, expected spray passes, and a conservative cost for missed weeds.
A defensible calculation then tests several scenarios: high versus standard detection sensitivity, patch treatment versus broadcast, spot treatment with and without a low-rate background application, and different weed-cover estimates. The result is not a universal payback claim. It is a documented, field-specific recommendation based on the weed pattern and the economics of the actual operation.
Green-on-brown spot spraying can produce a positive return when post-harvest weeds occupy a limited, mapped portion of the field and the avoided herbicide cost exceeds equipment, fee, operational, and escape-related costs. The strongest trial outcomes combine major reductions in herbicide use with control comparable to broadcast application, but those results depend on active detection, correct sensitivity, sound spray coverage, and integration with residual or other weed-management measures where needed.
A practical ROI assessment prices the entire workflow, including capital, depreciation, interest, subscriptions, chemical, treated proportion, logistics, and the future cost of missed weeds. Sairone can supply verified spatial evidence for this process through cloud imagery handling, AI detection, human validation, Atlas analysis, GIS export, and customizable integration. The final recommendation should use that evidence to protect weed-control efficacy as well as reduce unnecessary spray coverage.
