



Reducing Herbicide Costs with AI-Driven Weed Maps
Transform weed management with Sairone. Our AI-driven platform analyzes UAV data for precise, site-specific herbicide application, slashing costs and runoff
Written by Amirhossein
Reviewed by Boshra
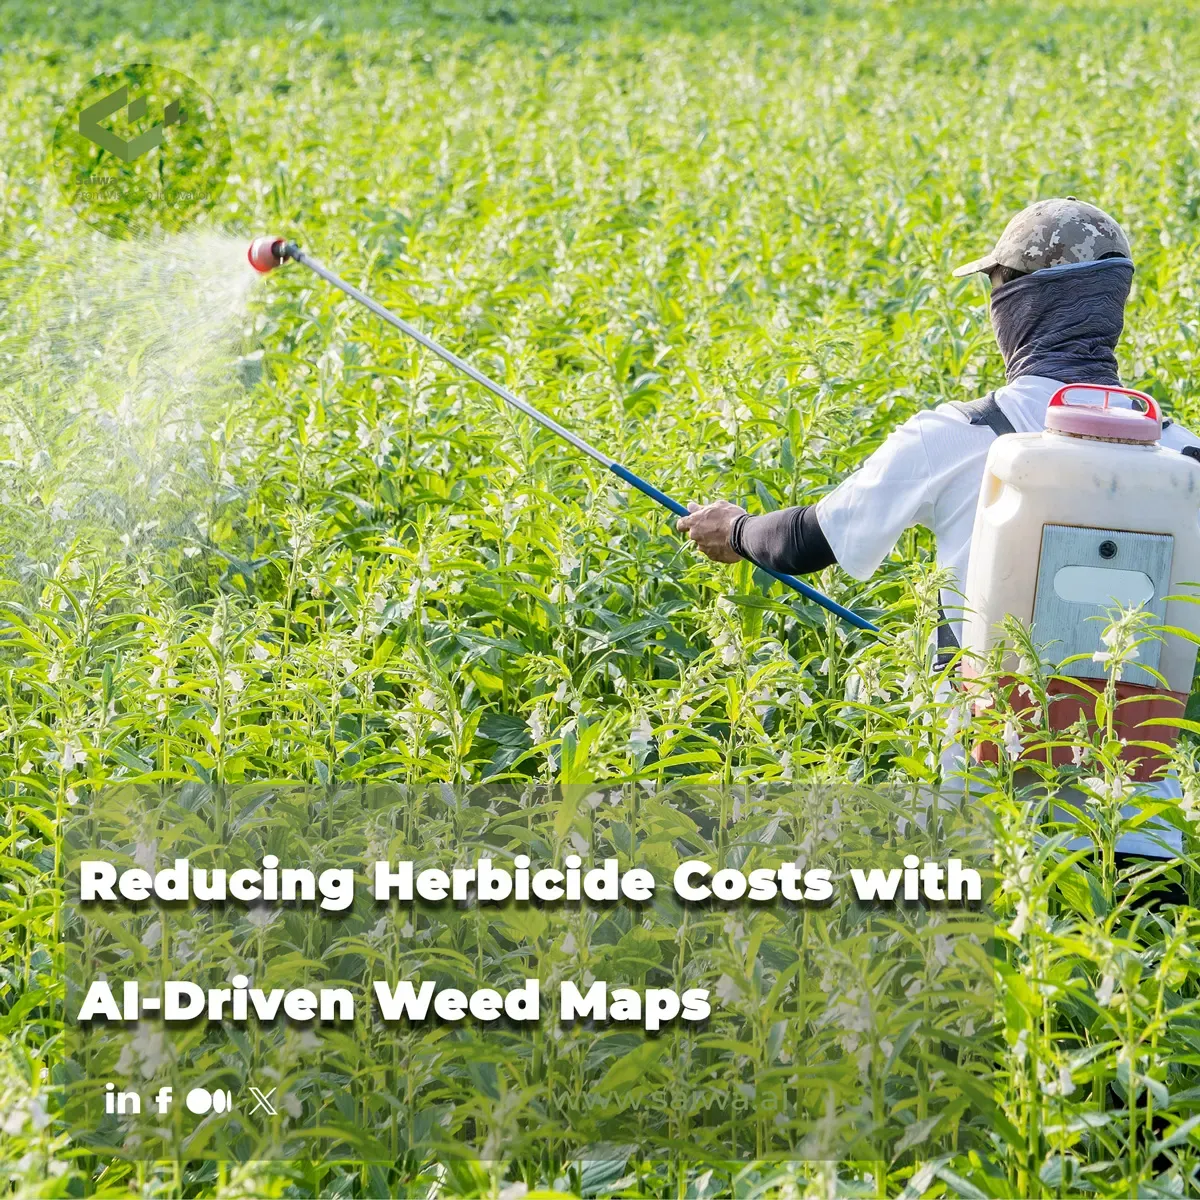
Weed Patchiness and the Case for Site-Specific Control
Modern agriculture operates on increasingly tight margins, pushing agronomists to optimize every chemical input applied to the soil. Traditionally, weed management relied on continuous, whole-field applications of herbicides. However, the spatial distribution of weeds within an agricultural landscape is rarely uniform. Instead, weed populations exhibit highly aggregated distributions, clustering in distinct patches driven by microclimates, localized soil moisture, and historical seed bank deposits. Site-Specific Weed Management (SSWM) addresses this reality by treating the field as a heterogeneous environment.
By identifying and mapping localized infestations, operators can restrict herbicide applications strictly to zones where weed densities exceed economic thresholds. This targeted approach fundamentally shifts the agronomic paradigm from preventive blanket spraying to reactive, precision intervention. Transitioning to SSWM requires reliable spatial data to guide machinery, which has driven the rapid adoption of remote sensing technologies and spatial mapping algorithms in commercial farming.
Spatial Heterogeneity, Emergence Timing, and the Limits of Blanket Spraying
The biological reality of weed emergence severely undermines the efficiency of uniform herbicide application. Weed species germinate and establish at different rates compared to cash crops, creating a dynamic biological environment where competition occurs in isolated pockets. Spatial heterogeneity means that in a standard field, significant percentages of the arable land may harbor weed populations well below the threshold that justifies chemical intervention.
Blanket spraying fundamentally ignores this spatial variability. When an entire field is treated uniformly, herbicides are applied to bare soil and healthy crop canopies where no weed threat exists. This leads to profound chemical waste. Furthermore, because emergence timing varies across the field due to localized topographical features and moisture gradients, a single uniform application often fails to control later-emerging weed cohorts, requiring subsequent passes that compound operational costs.
Environmental and Regulatory Pressure to Reduce Herbicide Use
Beyond direct financial costs, agronomic operations face intensifying scrutiny regarding the environmental footprint of agrochemicals. Broadcast herbicide applications contribute heavily to chemical runoff, contaminating adjacent waterways and degrading soil microbiomes. Additionally, exposing sub-lethal weed populations to continuous chemical pressure accelerates the evolutionary development of herbicide-resistant weed biotypes, a primary threat to global food security.
Regulatory agencies worldwide are responding to these ecological threats by tightening restrictions on the volume and frequency of active ingredients permitted per hectare. SSWM serves as a critical compliance mechanism. By applying herbicides exclusively to identified patches, farmers can drastically reduce their total chemical load—often cutting the volume of active ingredients applied by a significant margin. This reduction aligns agronomic practices with stringent environmental regulations while preserving the efficacy of existing chemical modes of action against resistant populations.
Low-Cost UAV Imaging for Operational Weed Mapping
The operational feasibility of SSWM relies entirely on the timely acquisition of high-resolution field data. Historically, satellite imagery lacked the spatial resolution required to detect early-stage weed seedlings, while manual ground scouting was prohibitively slow and labor-intensive. The integration of Unmanned Aerial Vehicles (UAVs) has bridged this data gap.
UAV platforms provide a low-cost, rapidly deployable mechanism for capturing field conditions with unprecedented clarity. Unlike satellites hindered by cloud cover and fixed orbital revisit times, drones can be deployed exactly when agronomic timing dictates, such as immediately prior to a critical post-emergence spray window. This localized control over data acquisition ensures that the resulting weed maps reflect current field realities rather than outdated observations.
RGB Drone Surveys, Orthomosaic Generation, and Sub-Centimetre Resolution
Standardizing aerial data collection begins with structured flight missions using UAVs equipped with consumer-grade RGB (Red, Green, Blue) sensors. To generate accurate maps, drones fly autonomous grid patterns with high front and side image overlap—typically between 70% and 85%. This overlap ensures that ground features are captured from multiple angles, an essential requirement for photogrammetry software.
Once the raw images are collected, specialized software stitches them together to produce a continuous, geometrically corrected image known as an orthomosaic. Because UAVs operate at low altitudes, the resulting spatial resolution is extraordinarily high. Ground Sample Distance (GSD) frequently achieves sub-centimetre resolution (e.g.), which provides sufficient morphological detail to distinguish narrow weed leaves from broadleaf crops and background soil textures.
Converting Imagery into Actionable Weed Distribution Maps
Raw orthomosaics, while visually informative, hold no direct utility for automated machinery until they are converted into classified distribution maps. This conversion process requires segmenting the image into distinct classes: crop, weed, and background (soil/residue). Early methodologies relied heavily on spectral indices, such as the Excess Green Index (ExG), to isolate vegetative pixels from soil.
Following initial segmentation, spatial and textural features are analyzed to differentiate crops from weeds. Because row crops are planted in predictable, geometric patterns, algorithms often identify the standard crop rows and classify any inter-row vegetation as weed matter. This step transforms billions of raw pixels into a simplified, binary spatial map detailing the exact coordinates of weed infestations across the surveyed geography.

Weed Detection Methods That Feed Prescription Maps
The accuracy of a precision application relies directly on the underlying detection algorithms processing the UAV imagery. Distinguishing between a cash crop and an invasive weed within a dense canopy is a complex computer vision challenge. Morphologies change rapidly during early growth stages, and varying light conditions create shifting shadows that confound simple analytical tools.
To overcome these variables, the agricultural technology sector has transitioned from rigid, rule-based image analysis toward advanced computational architectures. The chosen detection methodology dictates the speed, accuracy, and reliability of the final prescription map, ultimately determining whether the smart sprayer targets the correct vegetation in the field.
Deep Learning Architectures vs. Traditional Object-Based Image Analysis
Historically, Object-Based Image Analysis (OBIA) served as the standard for classifying aerial agricultural imagery. OBIA requires agronomists to manually define specific rules, shapes, and spectral thresholds to categorize vegetation. While effective in highly controlled environments, OBIA struggles to generalize across different lighting conditions, soil types, and overlapping leaf structures.
Conversely, deep learning models—specifically Convolutional Neural Networks (CNNs)—automate the feature extraction process. Rather than relying on human-defined rules, CNNs are trained on massive datasets of annotated field imagery. These models learn complex hierarchical features, allowing them to differentiate weeds from crops even when plants are partially occluded or visually similar. The robust adaptability of deep learning architectures has made them the preferred engine for processing modern agricultural drone data.
Sensitivity, Omission Error, and Conservative vs Aggressive Detection Behavior
In weed mapping, algorithm performance is evaluated through the balance of sensitivity and precision. An omission error occurs when the algorithm fails to detect a weed, leaving it untreated in the field. Given that a single surviving weed can produce thousands of seeds and repopulate a zone the following season, agronomists generally view omission errors as highly detrimental.
Consequently, agricultural AI models are frequently calibrated for conservative detection behavior, prioritizing high sensitivity to ensure maximum weed detection. This tuning intentionally accepts a higher rate of commission errors (falsely identifying a crop or soil patch as a weed). While aggressive sensitivity slightly reduces maximum chemical savings by over-prescribing treatment areas, it guarantees that agronomic risk is minimized and critical weed patches do not escape the sprayer.
Turning Detection Outputs into Spray Decisions
Identifying weeds on a digital map is only the analytical half of the process; the data must then be formatted to communicate with heavy agricultural machinery. Modern tractor implements, equipped with Variable-Rate Application (VRA) controllers, require structured, georeferenced instructions to actuate valves and nozzles.
Translating raw pixel classifications into mechanical action requires down-sampling the high-resolution data into a management grid. This grid serves as the spatial framework for the prescription map, dictating exactly where the boom sprayer should apply pressure and where it should shut off flow. The engineering constraints of the specific spraying equipment dictate how this map is structured and deployed.
Grid Cell Design Based on Nozzle-Level and Section-Level Sprayer Precision
The continuous digital map generated by the AI is divided into a discrete spatial grid. The dimensions of these grid cells cannot be arbitrary; they must align precisely with the mechanical resolution of the sprayer. For older or less advanced sprayers that operate via boom section control, grid cells must be relatively large—often measuring $3 \text{ m} \times 3 \text{ m}$ or wider—to match the width of the boom section that turns on or off as a single unit.
For advanced VRA sprayers equipped with individual nozzle control, the grid cells can be significantly smaller, typically ranging from $0.5 \text{ m} \times 0.5 \text{ m}$ to $1 \text{ m} \times 1 \text{ m}$. Matching the grid cell design to the nozzle footprint ensures that the digital instruction corresponds perfectly to the physical spray pattern, preventing over-application outside the target zone and ensuring full coverage within it.
Infestation Thresholds Based on Weed-Classified Pixels Within Each Cell
Once the grid is established, the system evaluates the density of weed pixels within each individual cell to determine if a spray action is warranted. This is governed by an infestation threshold. If the ratio of weed-classified pixels to total pixels within a specific grid cell exceeds the predefined threshold (for instance, $> 5\%$), that entire cell is marked with a "spray" command.
Setting this threshold is a critical agronomic decision. A threshold set at $0\%$ mandates spraying if even a single weed pixel is detected, maximizing control but minimizing herbicide savings. Conversely, setting a higher threshold ignores sparse, statistically insignificant weed populations, dramatically increasing chemical savings at the risk of slight yield competition.
Exporting Prescription Maps for Variable-Rate Application Systems
The final grid, now populated with binary spray/no-spray commands, is exported into standardized geospatial formats compatible with tractor terminals. Shapefiles (.shp) are the industry standard for this task, encapsulating the geometric boundaries of the grid cells alongside their associated spray attributes.
The farmer loads this prescription map into the tractor's VRA monitor via USB or wireless telemetry. As the tractor navigates the field, the onboard GNSS receiver tracks its position relative to the prescription map. When the sprayer boom crosses into a cell marked for treatment, the VRA controller instantaneously signals the solenoids to open the nozzles, applying herbicide exactly where the AI mapped the infestation.
Where Herbicide Savings Come From in Practice
The return on investment for drone-based weed mapping is calculated directly through the reduction of chemical inputs. By converting whole-field broadcast applications into localized, site-specific interventions, operations can retain significant capital that would otherwise be spent on wasted agrochemicals.
However, the exact volume of herbicide saved is not a static figure. It is heavily influenced by the interplay between the field's actual biological patchiness, the mechanical capabilities of the application equipment, and the risk tolerance configured into the detection algorithms. Understanding these variables is necessary to project realistic financial outcomes.
How Cell Size and Threshold Choice Change the Area Marked for Treatment
Grid cell resolution is the primary mechanical driver of herbicide savings. Larger grid cells—necessitated by older boom-section sprayers—result in substantial overspray, as a small weed cluster forces the activation of an entire $3$-meter boom section. By contrast, high-resolution grid cells corresponding to individual nozzle control minimize this overspray, tightly hugging the contours of the weed patch.
Furthermore, the choice of infestation threshold alters the treatment area. Research indicates that optimizing grid size in tandem with moderate pixel thresholds can yield chemical savings ranging from $30\%$ to exceeding $70\%$ in highly aggregated weed distributions,. Fine-tuning these two parameters allows farm managers to maximize their economic return without compromising crop health.
Adoption Barriers, Equipment Readiness, and the Fit for Small and Mid-Sized Farms
Despite the proven financial benefits, widespread adoption of UAV-driven weed mapping faces logistical hurdles. Processing heavy orthomosaics requires significant computational power, and navigating the technical software pipelines presents a steep learning curve for traditional agronomists. Furthermore, many small to mid-sized operations lack the capital required to retrofit existing sprayers with VRA technology or purchase individual-nozzle control systems.
Nevertheless, the landscape is shifting. As AI processing moves to accessible cloud platforms and drone hardware becomes commoditized, the barrier to entry is lowering. For operations that manage smaller acreage but face high chemical costs, outsourcing the mapping phase to specialized agronomic service providers presents a viable, immediate pathway to unlocking site-specific herbicide savings.
Sairone and its Field Application in AI-Driven Precision Agriculture
Scaling Remote Sensing Data through Cloud Intelligence
Sairone operates as an advanced, AI-driven platform developed by Saiwa, designed to overcome the computational bottlenecks inherent in modern precision agriculture. The platform is architected to seamlessly ingest massive volumes of high-resolution imagery captured from a diverse array of sources, including UAVs, satellite constellations, and machine-mounted optical sensors. By centralizing data processing in a robust cloud environment, Sairone eliminates the need for field operators to maintain expensive, localized hardware clusters.
A critical operational advantage of Sairone is its capacity to handle massive cloud uploads of complex geospatial data. Agricultural orthomosaics are notoriously large, frequently generated as high-density TIFF "mega files" that overwhelm standard desktop software. Sairone’s infrastructure processes these files natively without requiring local compression or resolution reduction, ensuring that the sub-centimetre fidelity captured by the drone is fully preserved for the detection algorithms.
Automated Species Identification and Density Mapping
At the core of the platform is its dedicated 'Weed and Invasive Plant Control' service, which leverages advanced computer vision to move beyond basic green-on-brown detection. Sairone is trained to execute complex, species-level identification within dynamic field environments. The AI can accurately isolate and classify specific invasive weeds—such as Taraxacum officinale, Amaranthus albus, Fleabane, and Thistle—distinguishing them not only from the cash crop but also from benign cover crops or residue.
By analyzing the spatial frequency and distribution of these specific classifications, Sairone generates exact spatial density maps. These maps provide agronomists with high-fidelity visualization of infestation severity across the terrain. Understanding the specific weed species present and their exact density allows for highly targeted chemical selection, ensuring that the applied herbicide targets the specific biology of the mapped invasive plant.
Translating Spatial Insights into Variable-Rate Field Action
Data visualization is only valuable if it drives mechanical execution. Sairone bridges this gap by outputting its spatial insights directly into standardized, GIS-based visualization layers designed for smart sprayer integration. Users can export their processed field data as Shapefiles, GeoJSON, CSV, or KML formats, ensuring absolute interoperability with a wide spectrum of modern tractor terminals and VRA controllers.
To streamline the operational workflow, Sairone features an advanced auto-clustering algorithm. Rather than presenting a chaotic, pixelated map of individual weeds, the algorithm intelligently groups affected field sections into clean, contiguous management blocks. This automated spatial grouping is executed within hours of data upload, drastically reducing the agronomic planning time required to prep a field for precise, variable-rate spraying.
Custom AI Infrastructure and Enterprise B2B Customization
Recognizing that agricultural operations vary wildly in their agronomic targets and equipment configurations, Sairone deliberately avoids rigid, one-size-fits-all software templates. The platform is engineered for deep Enterprise B2B customization, allowing large-scale agronomy firms and equipment manufacturers to integrate its intelligence into their specific operational frameworks. Clients can request customized plant detection models trained specifically on localized weed biotypes unique to their geographic region.
Furthermore, Sairone provides tailored reporting dashboards and extensive White Label options, allowing agricultural service providers to present the AI analytics under their own branding. Through its Back-end as a Service (BaaS) APIs, enterprise clients can bypass the Sairone frontend entirely, piping the computer vision processing power directly into their existing proprietary software ecosystems. This flexibility ensures the AI infrastructure aligns directly with the client's strategic operational goals.
Comments
No comments yet!
Table of Contents
No headings were found on this page.