


Pre-Seed Weed Mapping for More Cost-Efficient Winter Wheat Establishment
Pre-seed weed mapping helps winter wheat teams target treatment, manage weed biomass risk, and weigh mapping costs against establishment economics
Written by Amirhossein
Reviewed by Boshra
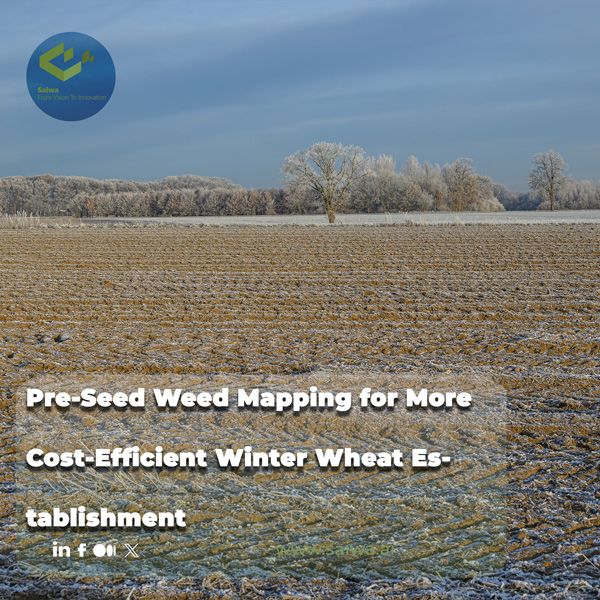
Winter wheat establishment begins before the drill enters the field. Weed pressure already present in the seedbed can compete for moisture, nutrients, light, and space as the crop establishes. The cost of that pressure is not fixed, however. It depends on weed biomass and emergence, wheat density and sowing date, soil and rainfall conditions, and the practical effectiveness of the management program selected for that field.
Pre-seed weed mapping gives agronomists and agricultural service providers a structured way to locate pressure before committing to a uniform treatment. This article explains how weed biomass relates to wheat yield, why that relationship cannot be reduced to a single universal threshold, and how spatial detection can improve the economics of pre-seed decisions. It also sets out how Sairone can process imagery, map detections, and provide GIS-ready outputs that support treatment planning for winter wheat establishment.
Why Pre-Establishment Weed Pressure Drives Wheat Economics
Weed competition can reduce winter wheat performance when it limits access to the resources needed for crop growth. The outcome is shaped by weed pressure, relative emergence timing, environmental conditions, and management practices that affect wheat density and canopy closure. The consequence is economic as well as biological: a field that enters the season with uneven weed pressure may not warrant the same treatment response across every hectare.
The pre-establishment period also determines what options remain available. Practices from the harvest of the preceding crop through wheat sowing, including tillage, false seedbeds, adjusted sowing date and density, mechanical control, and herbicide use, can influence the weed population that the crop encounters. Mapping has value when it improves the choice or placement of those actions.

Weed Competition Timing and Wheat Yield
A two-year wheat field trial found that weed-free periods produced better crop performance than equivalent periods of weed competition, demonstrating the value of early weed management. In that experiment, wheat established at 111 kg ha⁻¹ and kept weed-free for 75 days after sowing produced grain yields of 5,558.3 and 5,568.7 kg ha⁻¹ in the two study years. The treatment at 37 kg ha⁻¹ with weed competition for 75 days produced 3,277.5 and 3,230.1 kg ha⁻¹, respectively.
These numbers are results from a specific semi-arid trial, not a universal winter-wheat yield forecast. Their relevance lies in the mechanism: longer weed interference and lower crop density were associated with higher weed cover, density, and dry weight, while extended weed-free periods and the higher tested seed rate were associated with stronger crop growth and yield traits. Pre-seed assessment is useful because it identifies fields where early competition is likely to be part of the establishment risk.
Pre-Sowing Practices That Shape Weed Biomass
In a four-year on-farm assessment of 94 Swiss winter-wheat fields, the management practices recorded from the preceding harvest through wheat harvest included adapted tillage intensity, delayed sowing, mechanical weeding, false seedbeds, targeted herbicide applications, cover crops, adjusted sowing density and spacing, species mixtures, undersowing, and manual weeding. The study identified false seedbed preparation, sowing date and density, tillage intensity, herbicide application, rainfall, soil typology, and crop yield potential among the drivers of weed biomass and grain yield.
A false seedbed is specifically defined in that study as two tillage passes completed at least seven days before sowing. This illustrates why pre-seed weed management is a sequence rather than a single spray choice. A map showing patchy weed pressure can be read together with the intended sowing date, planned wheat density, available machinery, and the field’s soil and rainfall context before a treatment area is decided.
Weed Biomass–Yield Relationship as an Economic Threshold
Weed biomass is a useful measure because it expresses more than plant presence. It reflects the accumulated weed growth that has competed with the crop. Yet biomass should not be treated as an automatic trigger for a particular input. Field research shows that the relationship between weed biomass and wheat yield can be clear in some fields and highly variable in others.
Modeling the Weed Biomass–Yield Loss Threshold
The Swiss on-farm study used an asymptotic Cousens function to examine the relationship between dry-matter weed biomass and dry-matter grain yield. The estimated weed-free yield parameter was 5.82 t ha⁻¹, with a confidence interval of 5.43 to 6.21 t ha⁻¹. The initial yield-reduction parameter at 1 g m⁻² of weed biomass was estimated at 0.4%, while the asymptotic maximum yield-loss parameter was 58%.
The model was not equally descriptive across all fields. Only 25 of 94 fields fell within the study’s 98% confidence limits for the fitted curve, while 34 fields were above and 35 below those bounds. That result is particularly important for pre-seed weed mapping. A spatial layer can quantify where biomass or weed signals occur, but the expected yield consequence must still be interpreted within the conditions of the individual field.
Why Weed-Yield Outcomes Vary Across Fields
In the same project, 84 of 94 fields had pre-harvest dry-matter weed biomass below 50 g m⁻², and grain yield did not differ between herbicide-based and herbicide-free integrated weed-management strategies. The authors attributed the generally low weed pressure to combined management practices rather than simply low starting pressure. This reinforces the idea that a low biomass reading at one point in the season may reflect the success of a wider program, not the irrelevance of weed management.
Environmental and agronomic variation further complicate simple thresholds. Rainfall and soil conditions influence weed pressure and crop competition, while crop yield potential, tillage, sowing date, sowing density, false seedbed use, and herbicide or mechanical interventions influence both weed biomass and wheat yield. A field-level economic threshold must therefore be treated as a decision range informed by local data, rather than a single biomass number transferred unchanged from another farm.
Information Value Versus Treatment Value in Weed Mapping
A weed map is worth paying for when it changes a management decision. It may show that visible weeds occupy only limited patches, reveal a pattern that needs a broader response, or identify areas that should receive closer ground verification. It does not create crop value on its own. Its value comes from improving the match between actual weed pressure and the area, timing, or method of treatment.
For an agronomic service provider, the decision question is practical: will mapped information alter the recommended action enough to justify the cost of collecting and processing it? Where the answer is yes, the map becomes part of the economic case for precision establishment. Where the field is uniformly weedy, a broadcast option may still be the more straightforward operational decision.
What a Weed Map Changes in a Management Decision
High-resolution imagery and weed mapping can provide an operational picture of field conditions before treatment. TerraClear describes a workflow in which high-resolution imagery is analysed by AI models to produce a precision map, then used through an interactive map for weed spot-spraying. The principle is useful before winter wheat establishment: information can distinguish clean ground from areas where detected weeds justify attention.
Sairone follows a comparable data-to-decision sequence. Its Weed Control service processes high-resolution drone imagery, orthophotos, and georeferenced files, including GeoTIFF, TIFF, JPEG, and PNG. Detections can include confidence scores and geographic coordinates, and users can review, correct, and approve results before they are used in downstream planning. The validation step matters because a pre-seed application should be based on reviewed field evidence, not an unexamined detection layer.
When Spatial Weed Data Actually Shifts Treatment Choices
Spatial data has the greatest practical effect where pressure is heterogeneous and the operation can act on that variation. If weeds occur in defined patches, the map may support spot treatment, patch treatment, targeted mechanical work, or a decision to inspect selected areas more closely. If pressure is dispersed across the entire field, the map may confirm that the lower-cost operational choice is a whole-field program rather than numerous small treatment zones.
The timing of mapping also determines its value. It must be close enough to the intervention that the map still represents the field, while leaving enough time for validation, planning, and equipment logistics. This is especially relevant when pre-sowing actions such as false seedbeds, tillage, or delayed sowing are being considered alongside herbicide treatments.
Targeted Treatment Versus Broadcast Spraying: Cost Trade-Offs
Targeted treatment does not mean that every field should receive less herbicide. It means that the treated area should be a response to the mapped distribution and the biological significance of the weeds present. The economics improve when the reduction in treated area, active ingredient, and off-target application is not offset by meaningful weed escapes or additional operational complexity.
Economic Logic of Treating Only Detected Patches
Broadcast spraying applies the planned rate to every hectare, including ground with little or no weed pressure. TerraClear frames this as paying a full rate on largely clean ground and provides a weed-savings simulator that compares whole-field spraying with treatment restricted to mapped patches. The exact saving will depend on crop, field area, product price, and weed distribution, so a map should be used to calculate a specific field scenario rather than to assume a standard percentage reduction.
A targeted program also requires its own cost accounting. The field must be imaged, the data processed, weeds detected and verified, prescriptions or zones prepared, and the sprayer operated accurately enough to follow the planned pattern. These steps add information and operational costs, but they may be justified when the map prevents treatment of clean areas or improves management of high-pressure patches.
Herbicide-Use Reductions and Their Crop-System Limits
The PestiRed on-farm study shows that integrated winter-wheat management can maintain yield with or without herbicides where weed biomass is effectively controlled. Herbicide-free systems in that study relied more heavily on measures such as mechanical weeding, adapted tillage, delayed sowing, false seedbeds, and other preventive practices. Higher operational costs of herbicide-free integrated weed management could be offset by price premiums and direct payments, resulting in comparable profitability to herbicide-based systems under the reported conditions.
Those findings should not be turned into a claim that herbicides can always be removed without cost. The researchers explicitly caution against extending their results to contrasting agroecological settings, because the monitored fields generally had moderate weed pressure. The crop-system limit is clear: a lower herbicide bill is economically meaningful only when the wider management program controls weed biomass well enough to protect yield and future weed pressure.
Weighing the Cost of Information Against the Cost of Action
Pre-seed mapping is an information investment. The investment is justified when it improves the timing, placement, or selection of an intervention enough to outweigh the cost of obtaining the data. That may mean avoiding an unnecessary whole-field spray, finding patches that would otherwise be missed, or documenting why a preventive or mechanical approach should be used before drilling.
The Difficulty of Valuing Weed Control Under Uncertain Payoff
The value of weed control can be uncertain because wheat yield does not respond to weed biomass in exactly the same way in every field. Even among PestiRed fields with less than 0.5 g m⁻² of weed biomass, described as practically weed-free, grain yield ranged from 4 to 8.5 t ha⁻¹. Yield depends on far more than the observed weed layer, including rainfall, soil typology, crop yield potential, sowing timing, and management history.
This uncertainty does not make mapping irrelevant. It sets the correct expectation. A weed map is evidence about weed location and pressure, not a guarantee of a particular yield response. Its economic value rises when the map is combined with field records and agronomic knowledge that explain the crop sequence, weed species, planned establishment date, and feasible control options.
Herbicide-Based Versus Herbicide-Free Cost and Profitability
The Swiss study compared herbicide-based integrated weed management with herbicide-free integrated management across 94 winter-wheat fields from 2020 to 2023. Grain yield did not differ between the two strategy groups, while tillage intensity consistently reduced weed biomass. In herbicide-free fields, greater mechanical-weeding intensity was associated with yield penalties.
Profitability was context-dependent. The study reports that higher operating costs in herbicide-free systems may be compensated by price premiums and direct payments, making profitability comparable to herbicide-based systems in the studied setting. For a pre-seed decision, this means the comparison should include all feasible alternatives: herbicide, mechanical measures, preventive practices, market conditions, and available support mechanisms, rather than comparing only the purchase price of a herbicide with the cost of imagery.
Data Quality and Decision Confidence in Weed Assessment
Decision confidence is a product of data quality and interpretation. A map must correctly locate and classify field features at a level appropriate for the proposed intervention, while the agronomist must understand the limits of translating observed weed pressure into a yield and profitability forecast.
Field Variability and the Reliability of Weed-Yield Data
Field variability is not noise that can be ignored. The PestiRed analysis used a multi-step approach incorporating nonlinear weed-yield modelling, variance-inflation filtering, random-forest classification, and linear mixed-effects models to handle complex, partly correlated data. Its results showed that weed biomass and yield were affected by combined management, environment, soil, and crop factors.
For practical weed mapping, this supports a disciplined workflow: use mapped observations to locate potential treatment areas, validate the detections, and interpret them against field-specific conditions. Sairone supports this process with review and approval of AI-generated detections, plus Atlas for interactive visualization, spatial analysis, and high-resolution aerial or satellite imagery overlays. Such controls help ensure that an imagery-derived signal becomes a reviewed agronomic input rather than an automatic instruction.
From Weed Signals to Targeted Wheat Treatment: Sairone's Role
Sairone is a B2B SaaS platform designed for agronomy, agricultural service providers, cooperatives, and related organizations that need to convert visual and georeferenced data into practical outputs. It applies AI, computer vision, machine learning, and geospatial analysis to weed and invasive-plant control, crop monitoring, yield estimation, and other agricultural and environmental workflows.
For pre-seed wheat management, Sairone can support the information stage of the decision. It does not replace agronomic judgement about product choice, soil, rotation, or crop establishment. Instead, it provides a workflow for organising imagery, locating detections, validating results, analysing their spatial pattern, and exporting the information into systems used for targeted planning.
Turning Drone and Satellite Imagery Into Field-Ready Weed Data
Sairone accepts high-resolution drone imagery, orthophotos, georeferenced datasets, and formats including GeoTIFF, TIFF, JPEG, and PNG. It can also process images, videos, and orthomosaics, and can create orthomosaics from video. Its cloud-based platform allows users to upload data and create reports without developing or maintaining dedicated processing infrastructure.
The Files environment stores imagery, inputs, processed outputs, folders, and large datasets. Combined with annotation tools for polygons, bounding boxes, class definitions, custom colours, and multi-class labelling, this gives technical teams a structured route to prepare data and refine models for specific agricultural applications.
Mapping Weed Pressure to Inform Pre-Seed Decisions
Sairone Weed Control is designed to detect, map, and analyse weeds and invasive plants across agricultural fields and natural environments. Its documented species coverage includes Taraxacum, Amaranthus tuberculatus, Amaranthus palmeri, European Water Chestnut, Water Soldier, Fleabane, and Thistle. Each detection can contain a confidence score and precise geographic coordinates, supporting field review and targeted planning.
Validated detections can move to Atlas, Sairone’s geospatial environment for mapping weed distributions, analysing infestation patterns, and generating treatment maps. Atlas provides custom region definition, hierarchical field-zone management, and analytical views using high-resolution satellite and aerial imagery overlays. These functions allow a service provider to compare mapped pressure with the practical boundaries used in a pre-seed management plan.
GIS-Ready Treatment Zones for Targeted Spraying
Sairone exports detections in GeoJSON, Shapefile, KML, and CSV formats. These GIS-ready outputs can be transferred into geospatial and operational systems used for spatial analysis and precision-spraying workflows. The format flexibility helps preserve the connection between the original detection result and the treatment-zone planning process.
Atlas includes detection-clustering algorithms that group identified weeds into manageable treatment zones. This turns individual geolocated detections into spatial units that can be reviewed against field constraints, expected treatment cost, and the planned winter-wheat establishment program. The platform produces decision-supporting spatial information; the final treatment recommendation still requires an agronomic assessment of the field context.
Custom Models and White-Label Enterprise Integration
Saiwa develops and customizes AI models according to the user’s needs and the nature of the available data. This approach allows models and reporting workflows to be adapted to defined agricultural or environmental challenges rather than forcing every client into a single generic configuration.
Sairone is available through a cloud platform, customized API integration, and fully customized White Label deployment. The API option can connect Sairone services to existing client infrastructure, while White Label delivery can be developed around the customer’s brand, operational needs, and workflow. Saiwa also describes BaaS and a multi-tenant structure for agritech organizations seeking outsourced product-development capabilities.
Conclusion
Pre-seed weed mapping can improve the cost efficiency of winter-wheat establishment when it changes a real management decision. Weed biomass and crop response are shaped by timing, density, sowing practices, soil, rainfall, and the wider integrated weed-management program, so a universal treatment threshold is not scientifically defensible. Mapping is most valuable when it distinguishes clean ground from priority patches and the operation has a practical way to act on that distinction.
A rigorous workflow combines spatial information with validation and field-specific agronomy. It weighs the cost of imagery and targeted operations against the cost of unnecessary broadcast treatment, missed weed pressure, and reduced establishment performance. Sairone supports this workflow by processing imagery, recording and validating geolocated detections, visualizing them in Atlas, clustering them into treatment zones, and exporting GIS-ready data for operational planning.
References (1)
About the team
Continue reading
When Delaying Post-Harvest Weed Control Costs More Next Season
A post-harvest weed flush can look less urgent than a problem in a standing cash crop. That impression is often expensive. Escaped weeds con
Volunteer Canola After Harvest: When Is Spraying Worth the Cost?
Volunteer canola is a post-harvest management issue with both immediate and multi-season consequences. Seed lost during combining can germin
A Practical Framework for Using Fall Weed Maps to Make Better Spray Decisions
A fall weed map is useful only when it changes what happens next. It may show where weeds survived, where patches are recurring, or where a
Evaluating the ROI of Green-on-Brown Spot Spraying for Post-Harvest Weed Control
Post-harvest fields often show an uneven weed pattern: a few dense patches, thin linear infestations, and large areas with little green vege

Reducing Misclassification in AI Invasive Species Detection
Misclassification can undermine an invasive-species monitoring program even when a model reports strong aggregate accuracy. A false positive
Seasonal Phenology for AI-Based Invasive Plant Detection
Seasonal phenology provides the biological timing framework needed to improve AI-based invasive plant detection. Plant growth, flowering, le
Comments
Be the first to share your thoughts
No comments yet
Start the conversation by sharing your thoughts
Share this article
Help others discover this content
Table of Contents
No headings were found on this page.