Waterhemp Detection in Corn Field by using a Semantic Segmentation model
Dec 31, 2025
Written by: Amirhossein Komeili
Reviewed by: Boshra Rajaei, PhD
Waterhemp Detection in Corn Field by using a Semantic Segmentation model
One of the main and important challenges for farmers in the process of growing crops is timely identifying and controlling weeds . Early detection and management of them can have a great impact on increasing the quality of the crop. Dealing with this challenge becomes more difficult and serious when the crop is being grown over a large area and monitoring and managing all its parts is a difficult task.
What is the project about?
In this blog we want to talk about detecting waterhemp in a corn field. What is the main problem?. Why is detecting waterhemp important?
Waterhemp is a highly competitive weed that interferes with corn growth by competing for essential resources such as nutrients, water, light, and space. One of the major consequences of waterhemp infestation is reduced nitrogen availability for corn, which can lead to nitrogen deficiency, stunted growth, lower biomass production, and ultimately yield loss. Because waterhemp has a rapid growth rate and high adaptability, it can quickly dominate the field if not managed properly. Therefore, early detection of waterhemp is crucial, as it enables farmers to implement timely and effective management strategies, such as targeted herbicide application or mechanical control, to limit its spread and minimize its negative impact on corn production.
What is our approach?
1- Data Collection
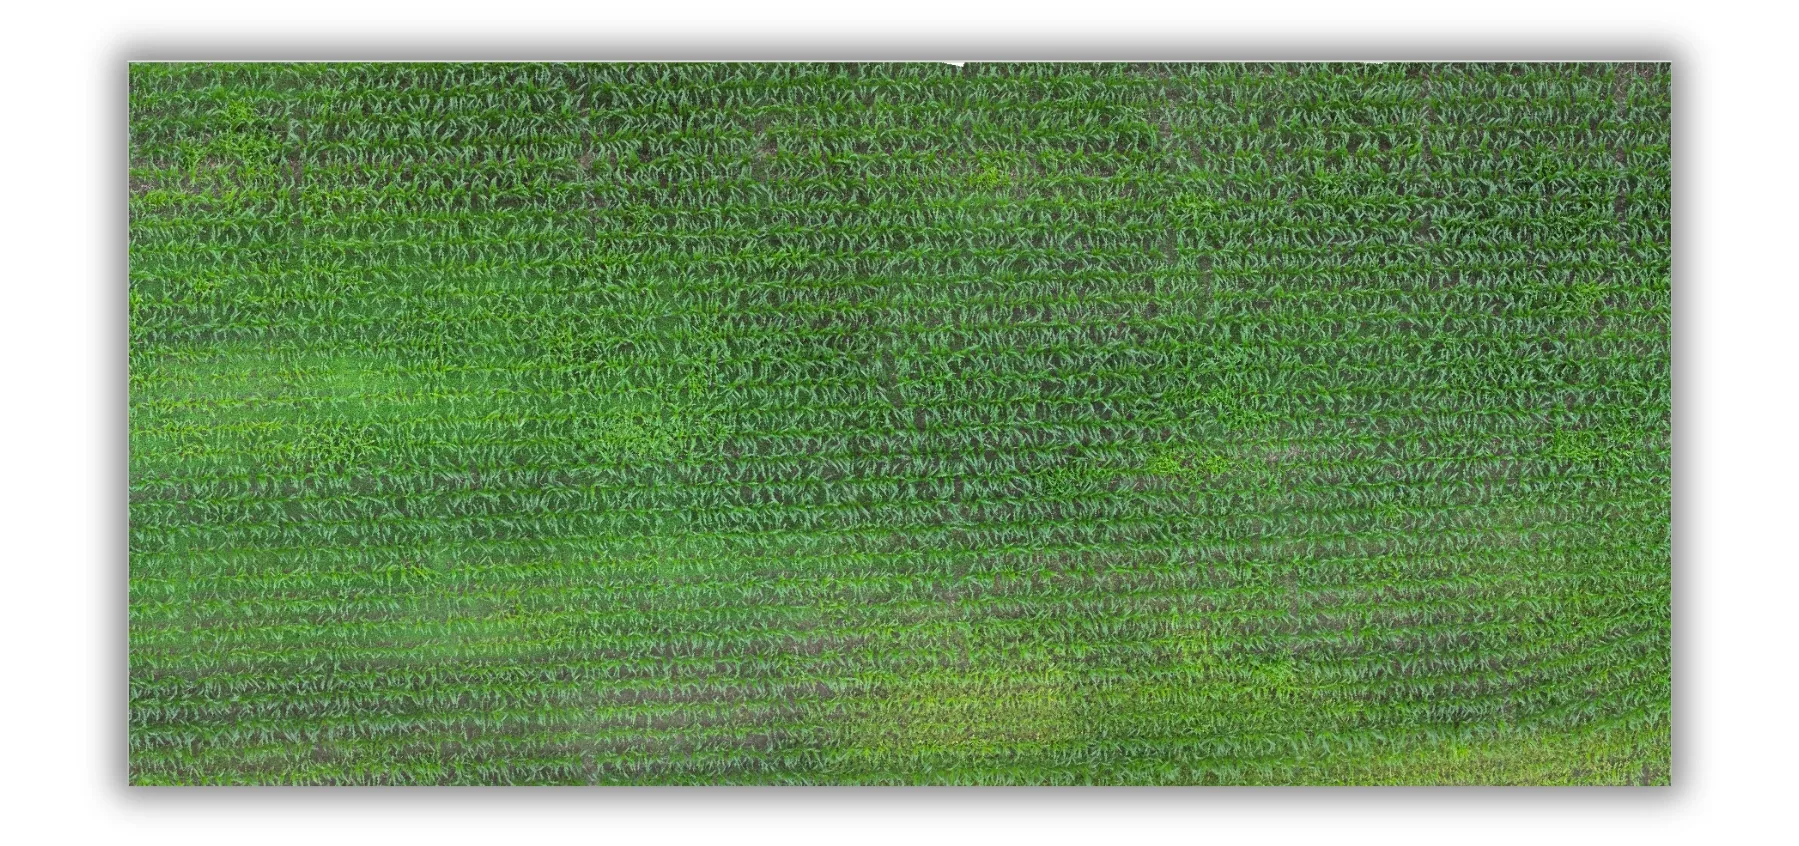
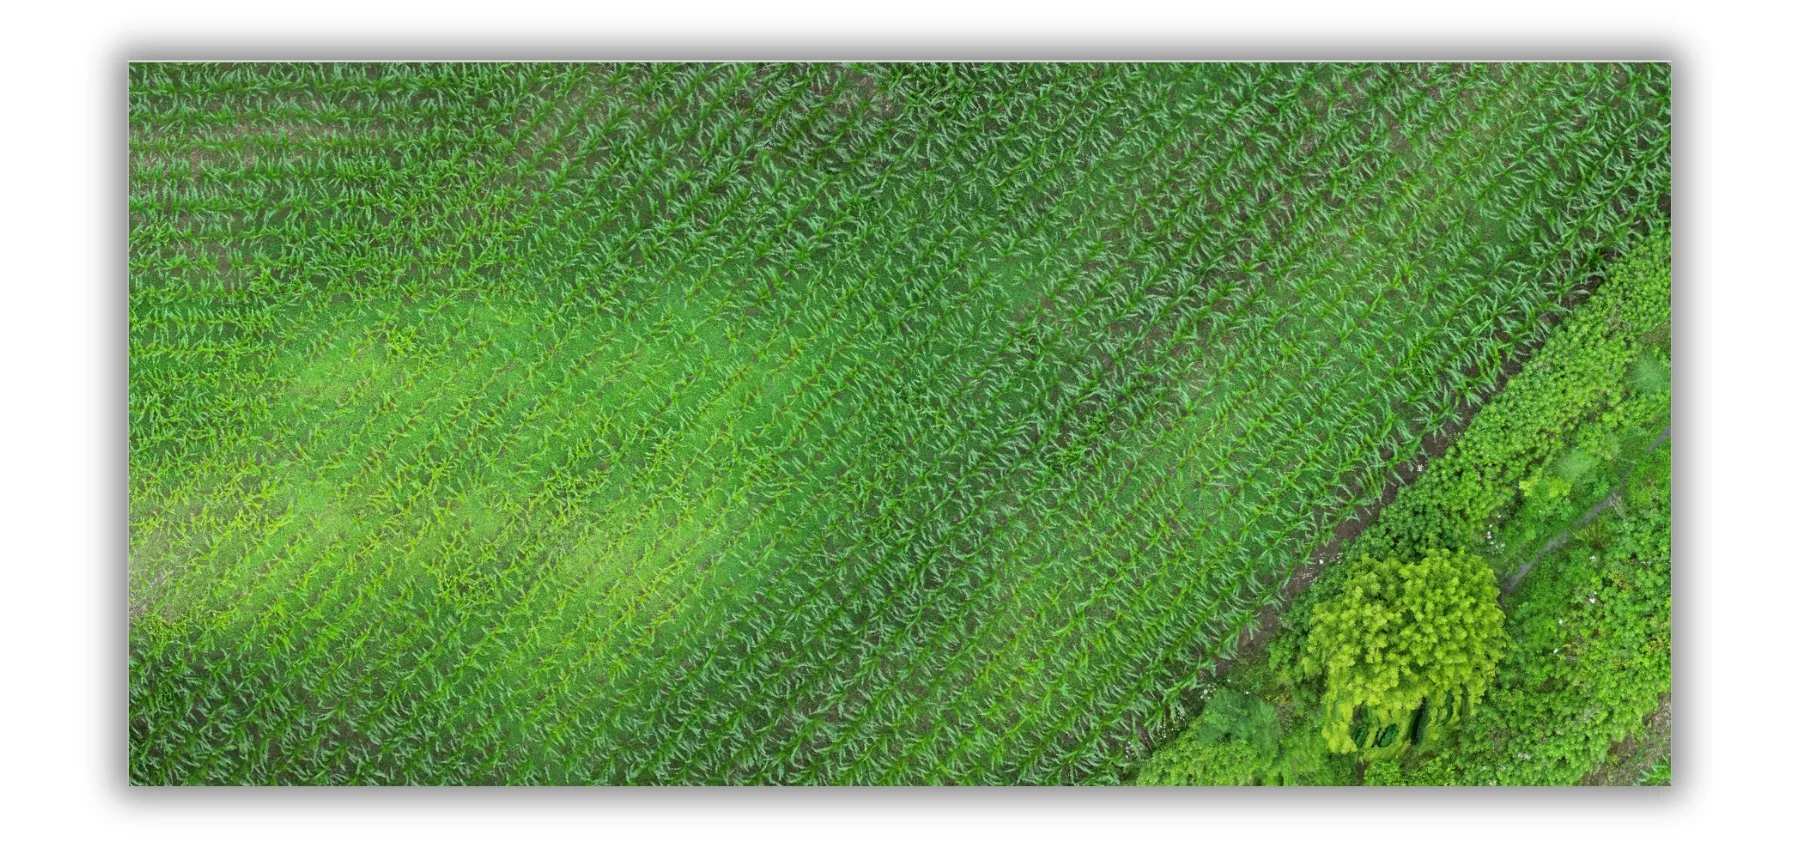
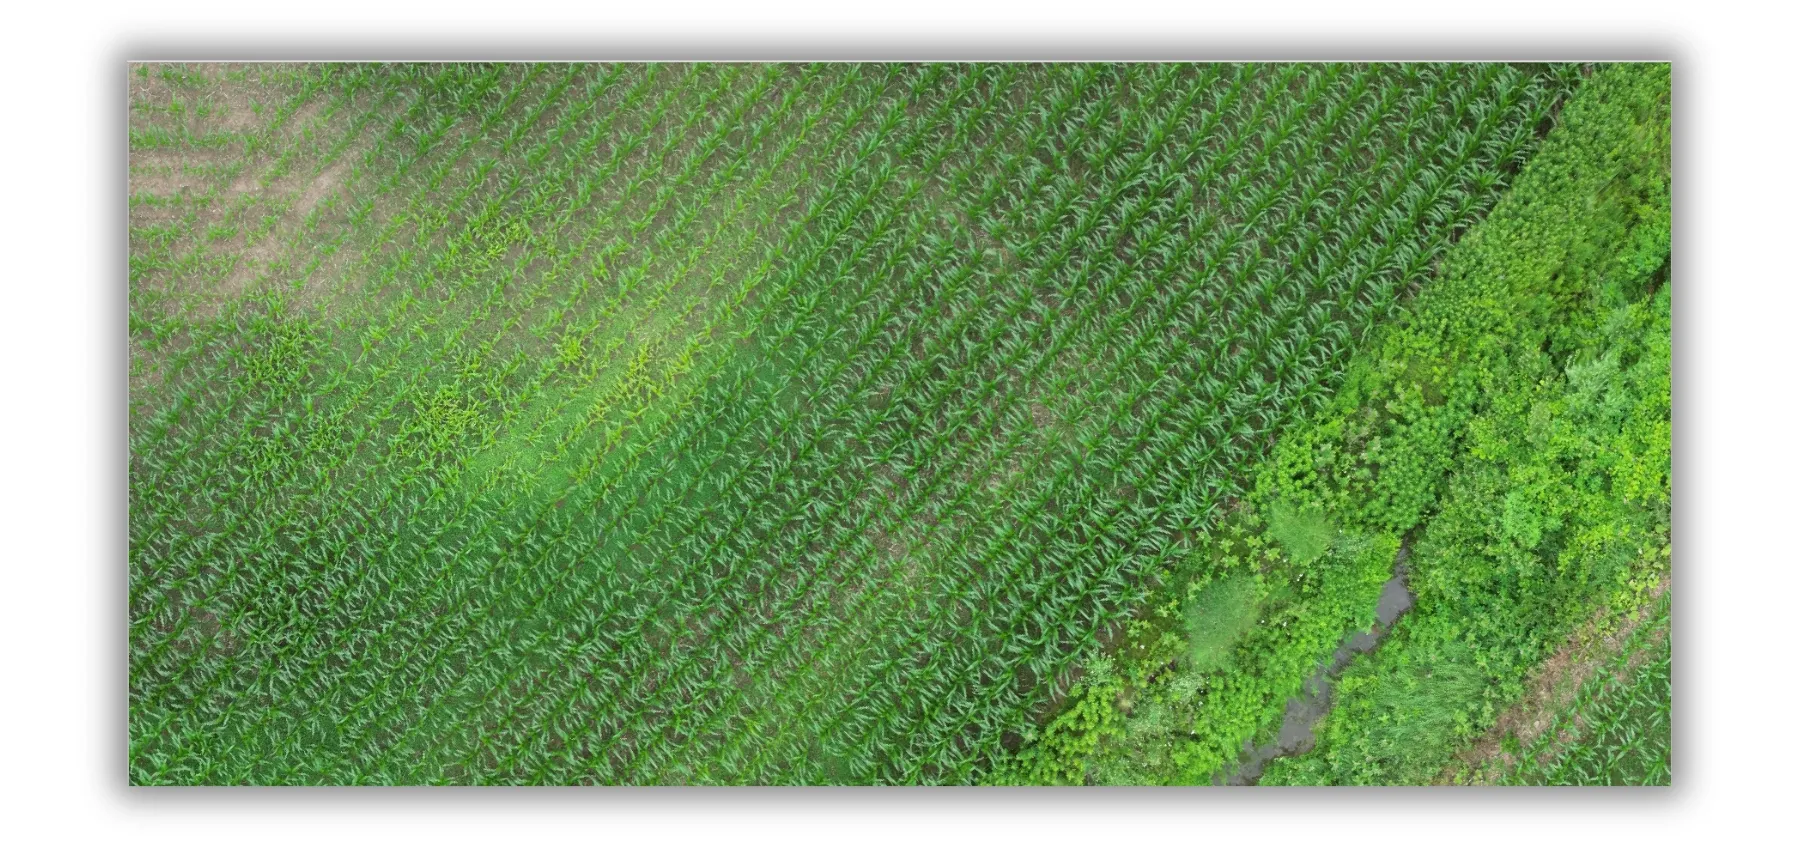
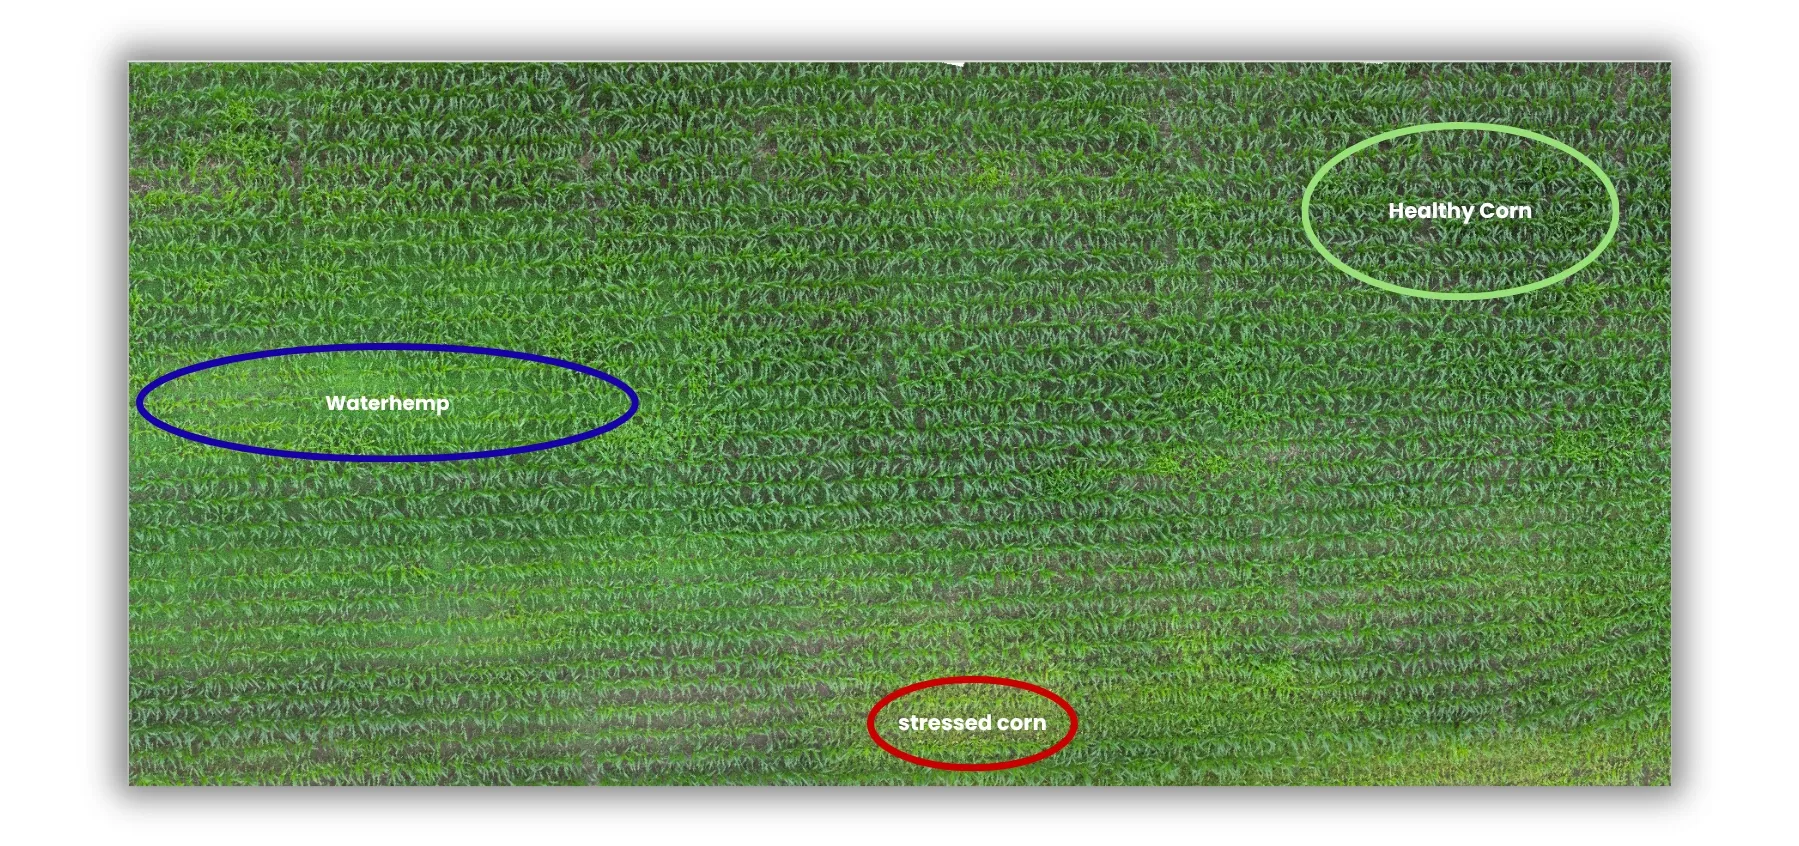
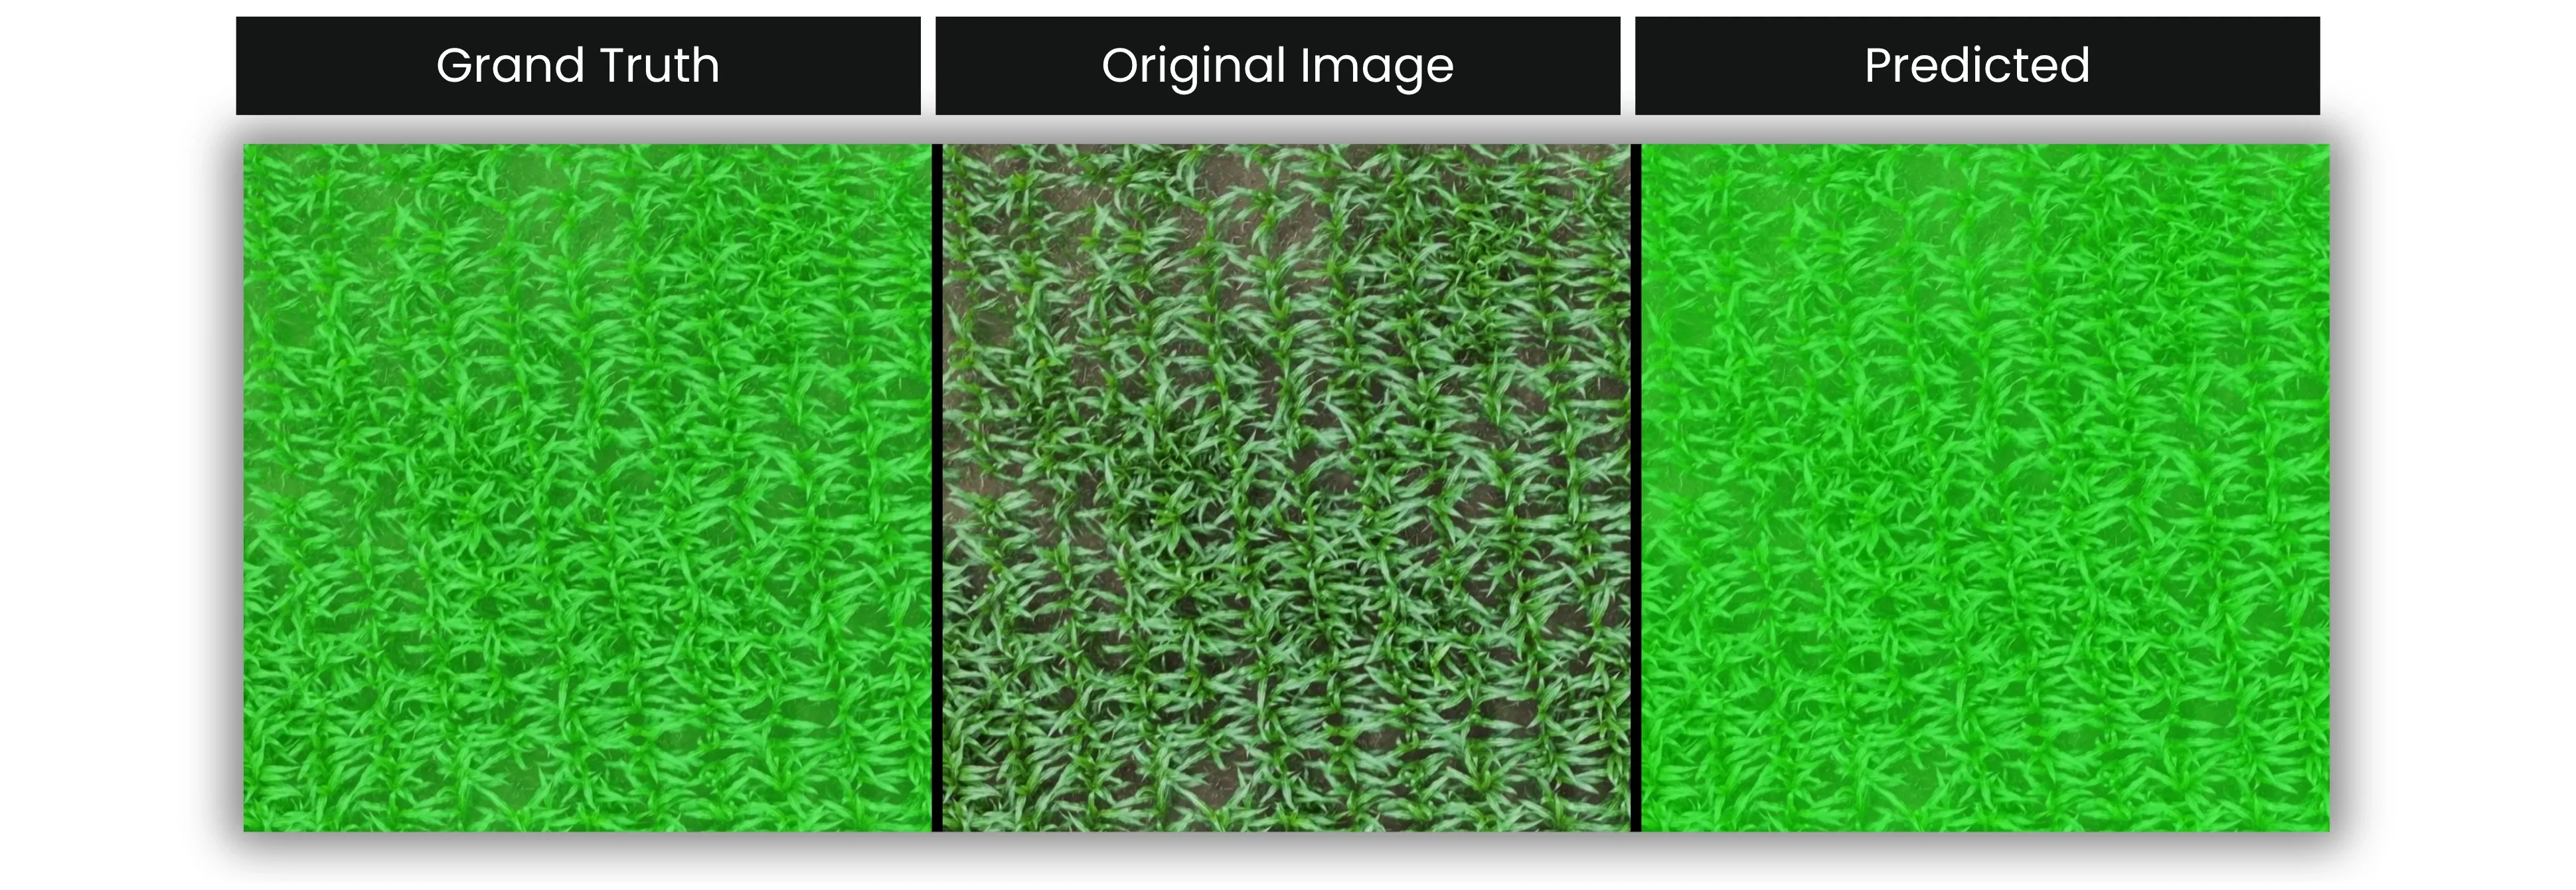
We collected some images of a corn field using a drone. You can see some examples below:

2- Analysis the images
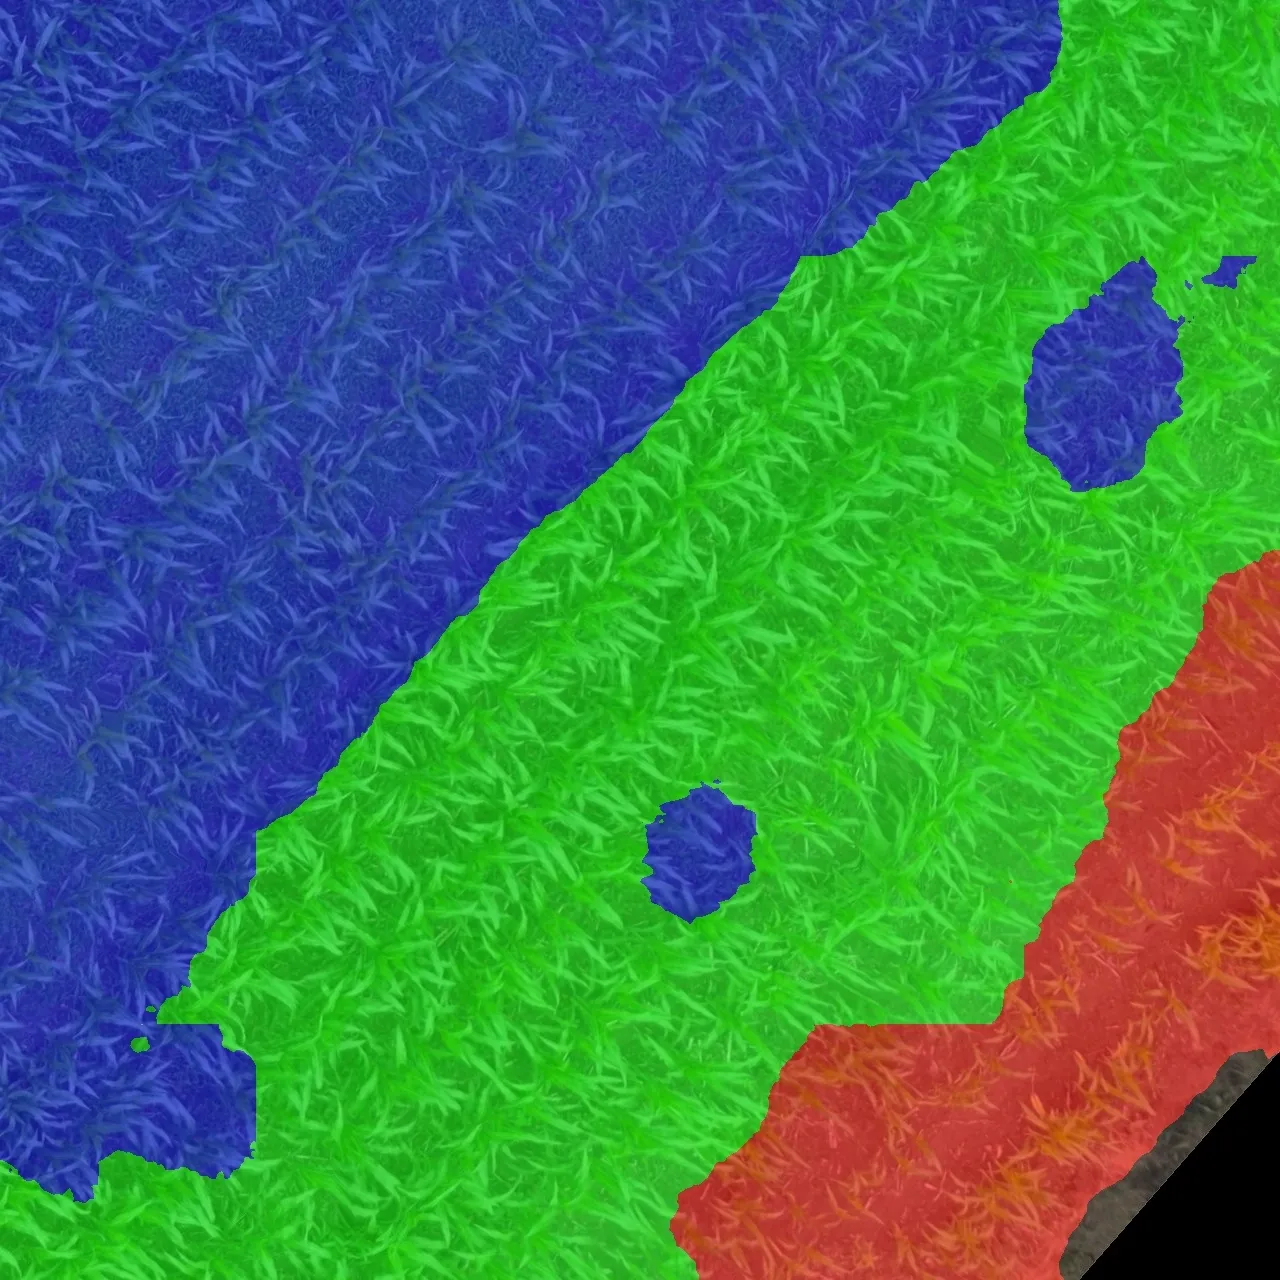
The main goal of this project is to detect waterhemp, however, we propose an approach that detects three categories: areas containing waterhemp, areas containing healthy corn, and areas containing stressed corn. This approach gives farmers more information about the condition of their fields and allows them to manage and plan for each area separately. First, look at the image below to better understand what we want to do:
Based on the experience gained from projects such as Pine Counting, Fleabane Detection, Paper Surface Defect Detection etc. we found that when we face a problem that does not require the recognition of objects with a well-defined and regular shape, it is better to use segmentation models instead of detection models. On the other hand, in this project, we need to classify different areas within an image, that is, we need to assign a class to each pixel, so the best way to do this is to use semantic segmentation models.
3- Annotation Data
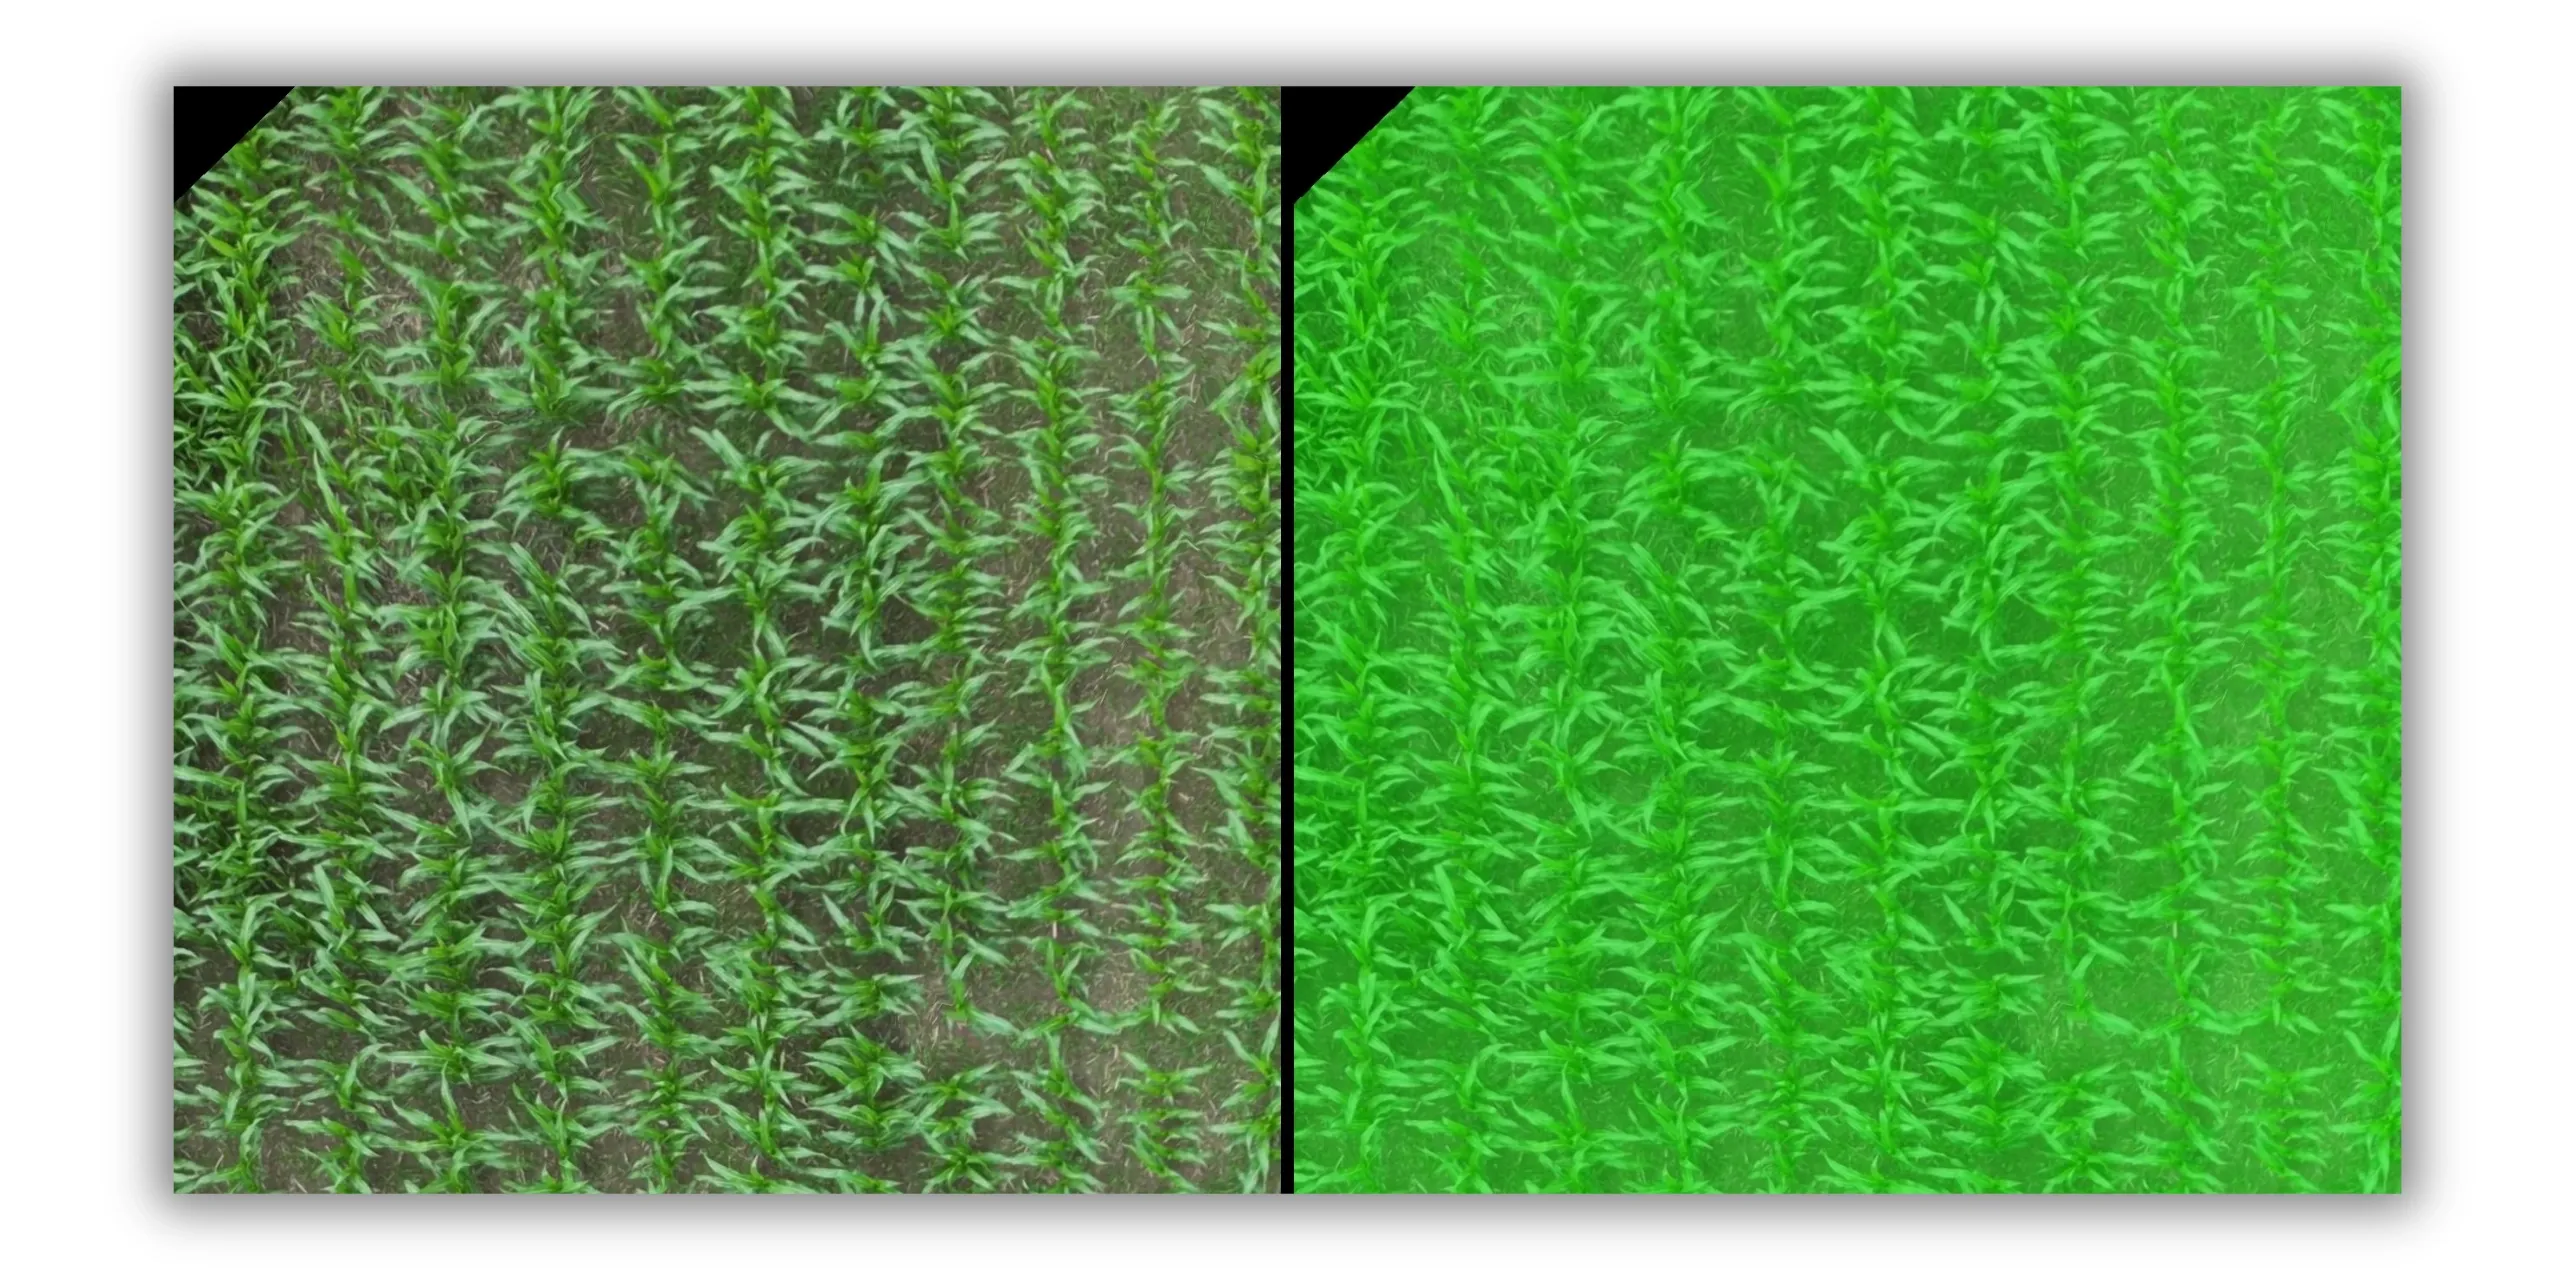
Accordingly, we annotated the collected images. We did this using the Sairone annotation tool, examples of which can be seen in the images below:


Results
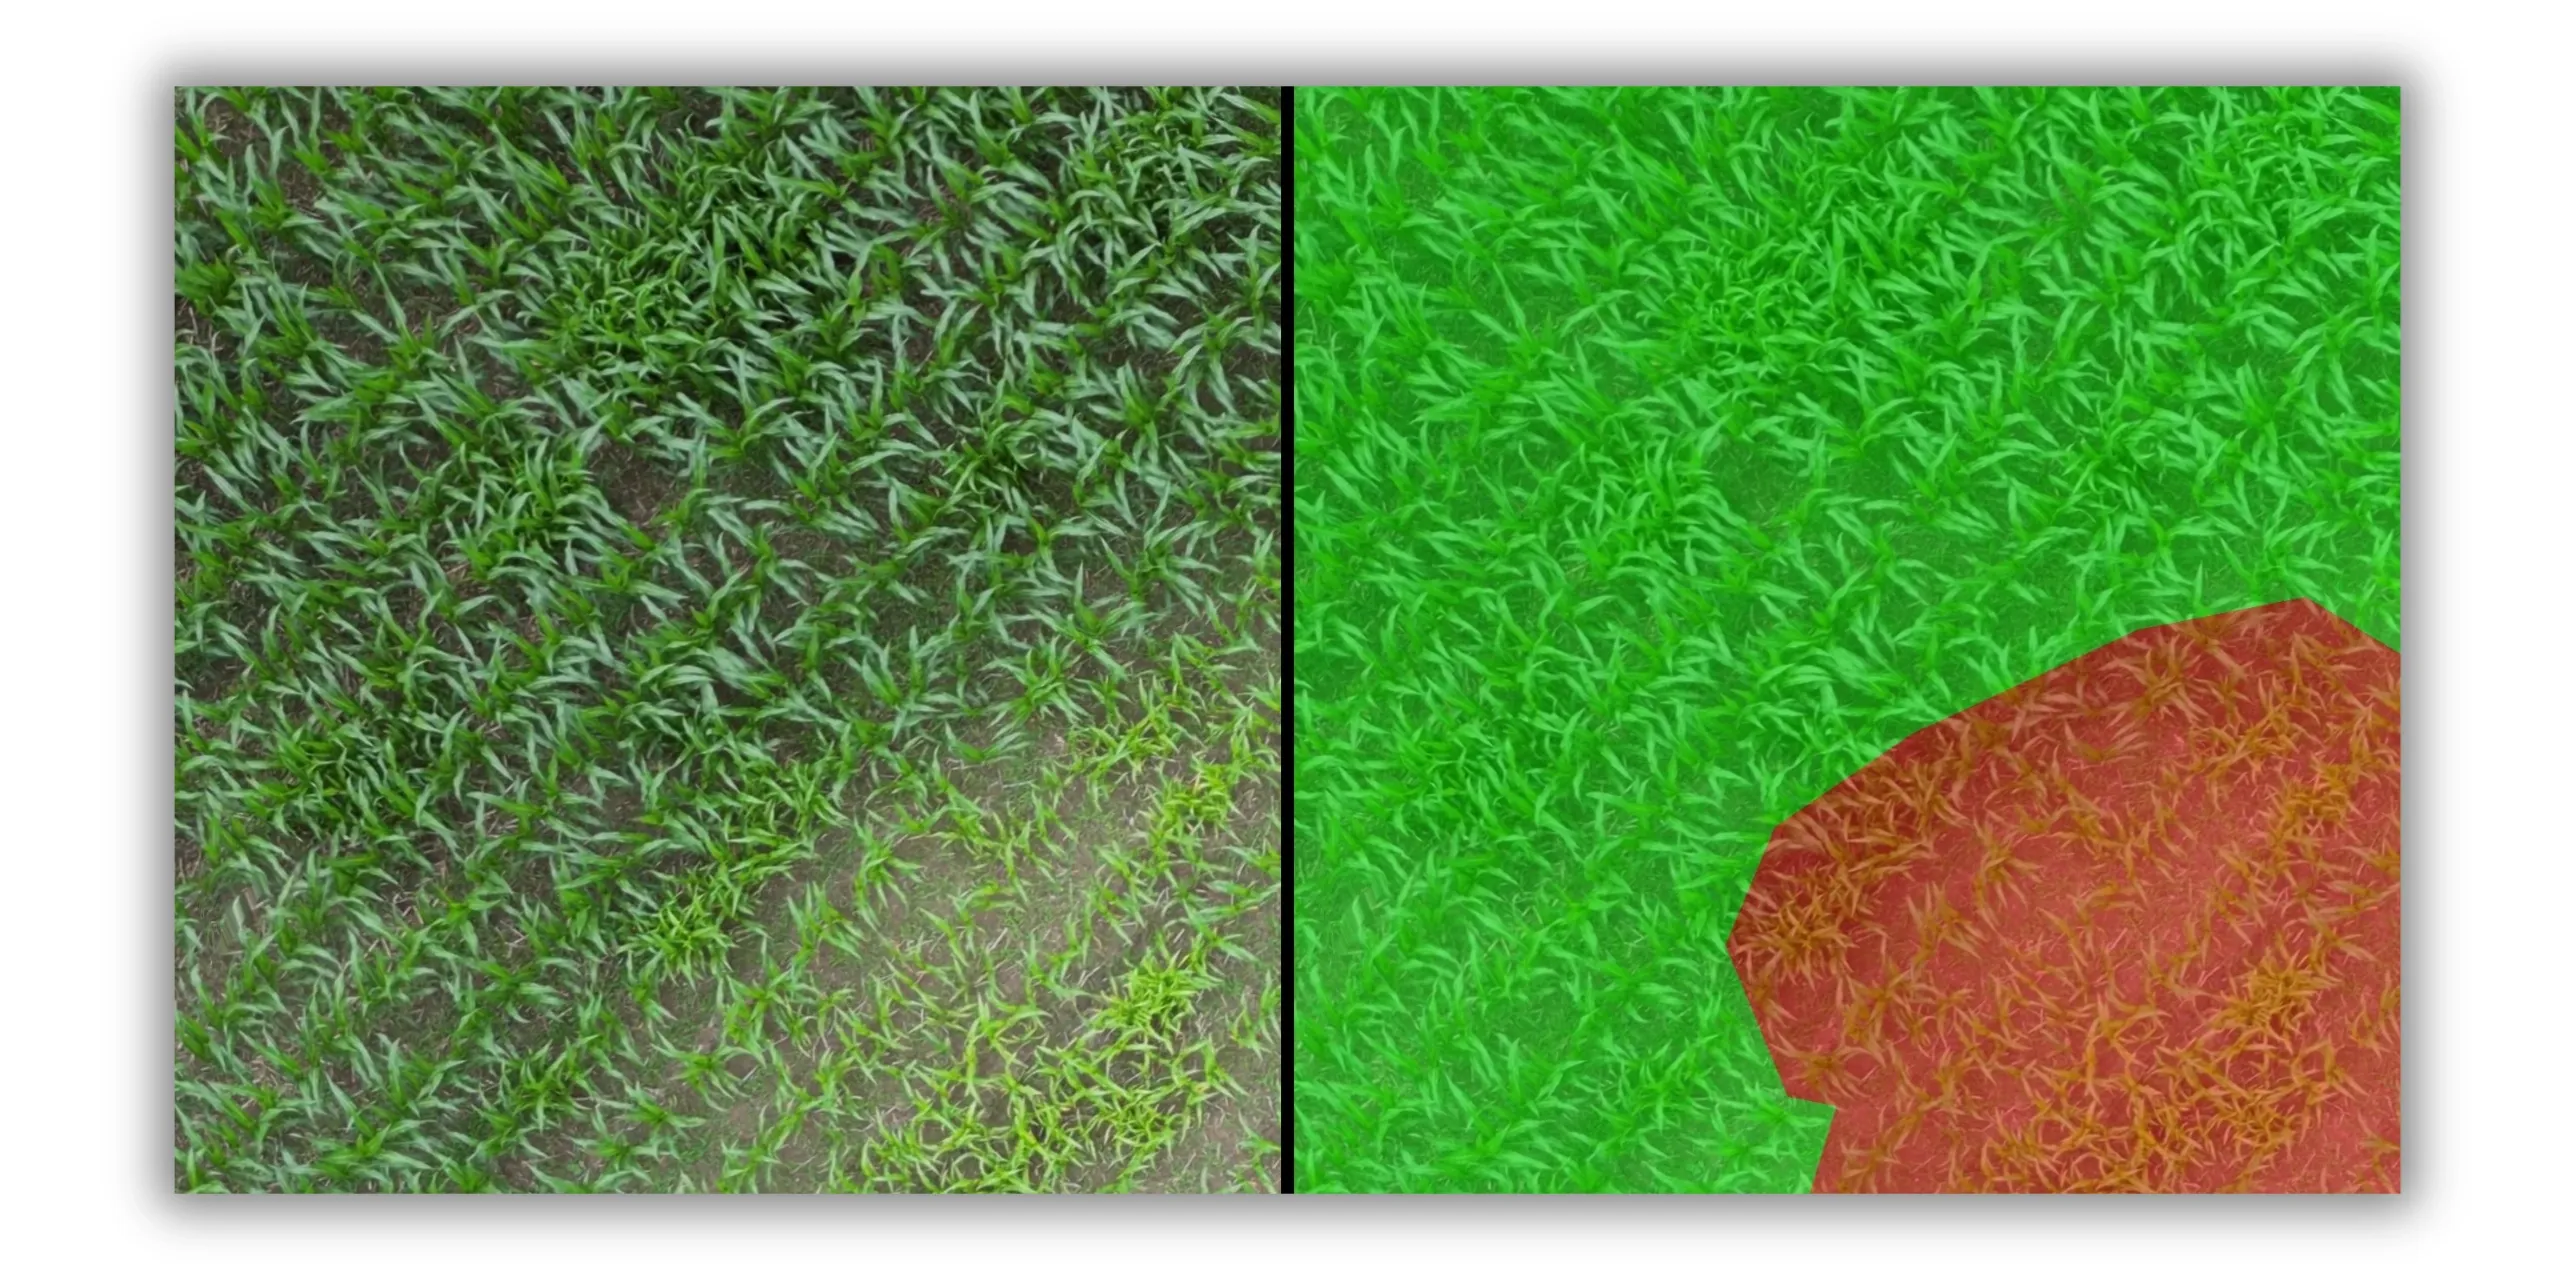
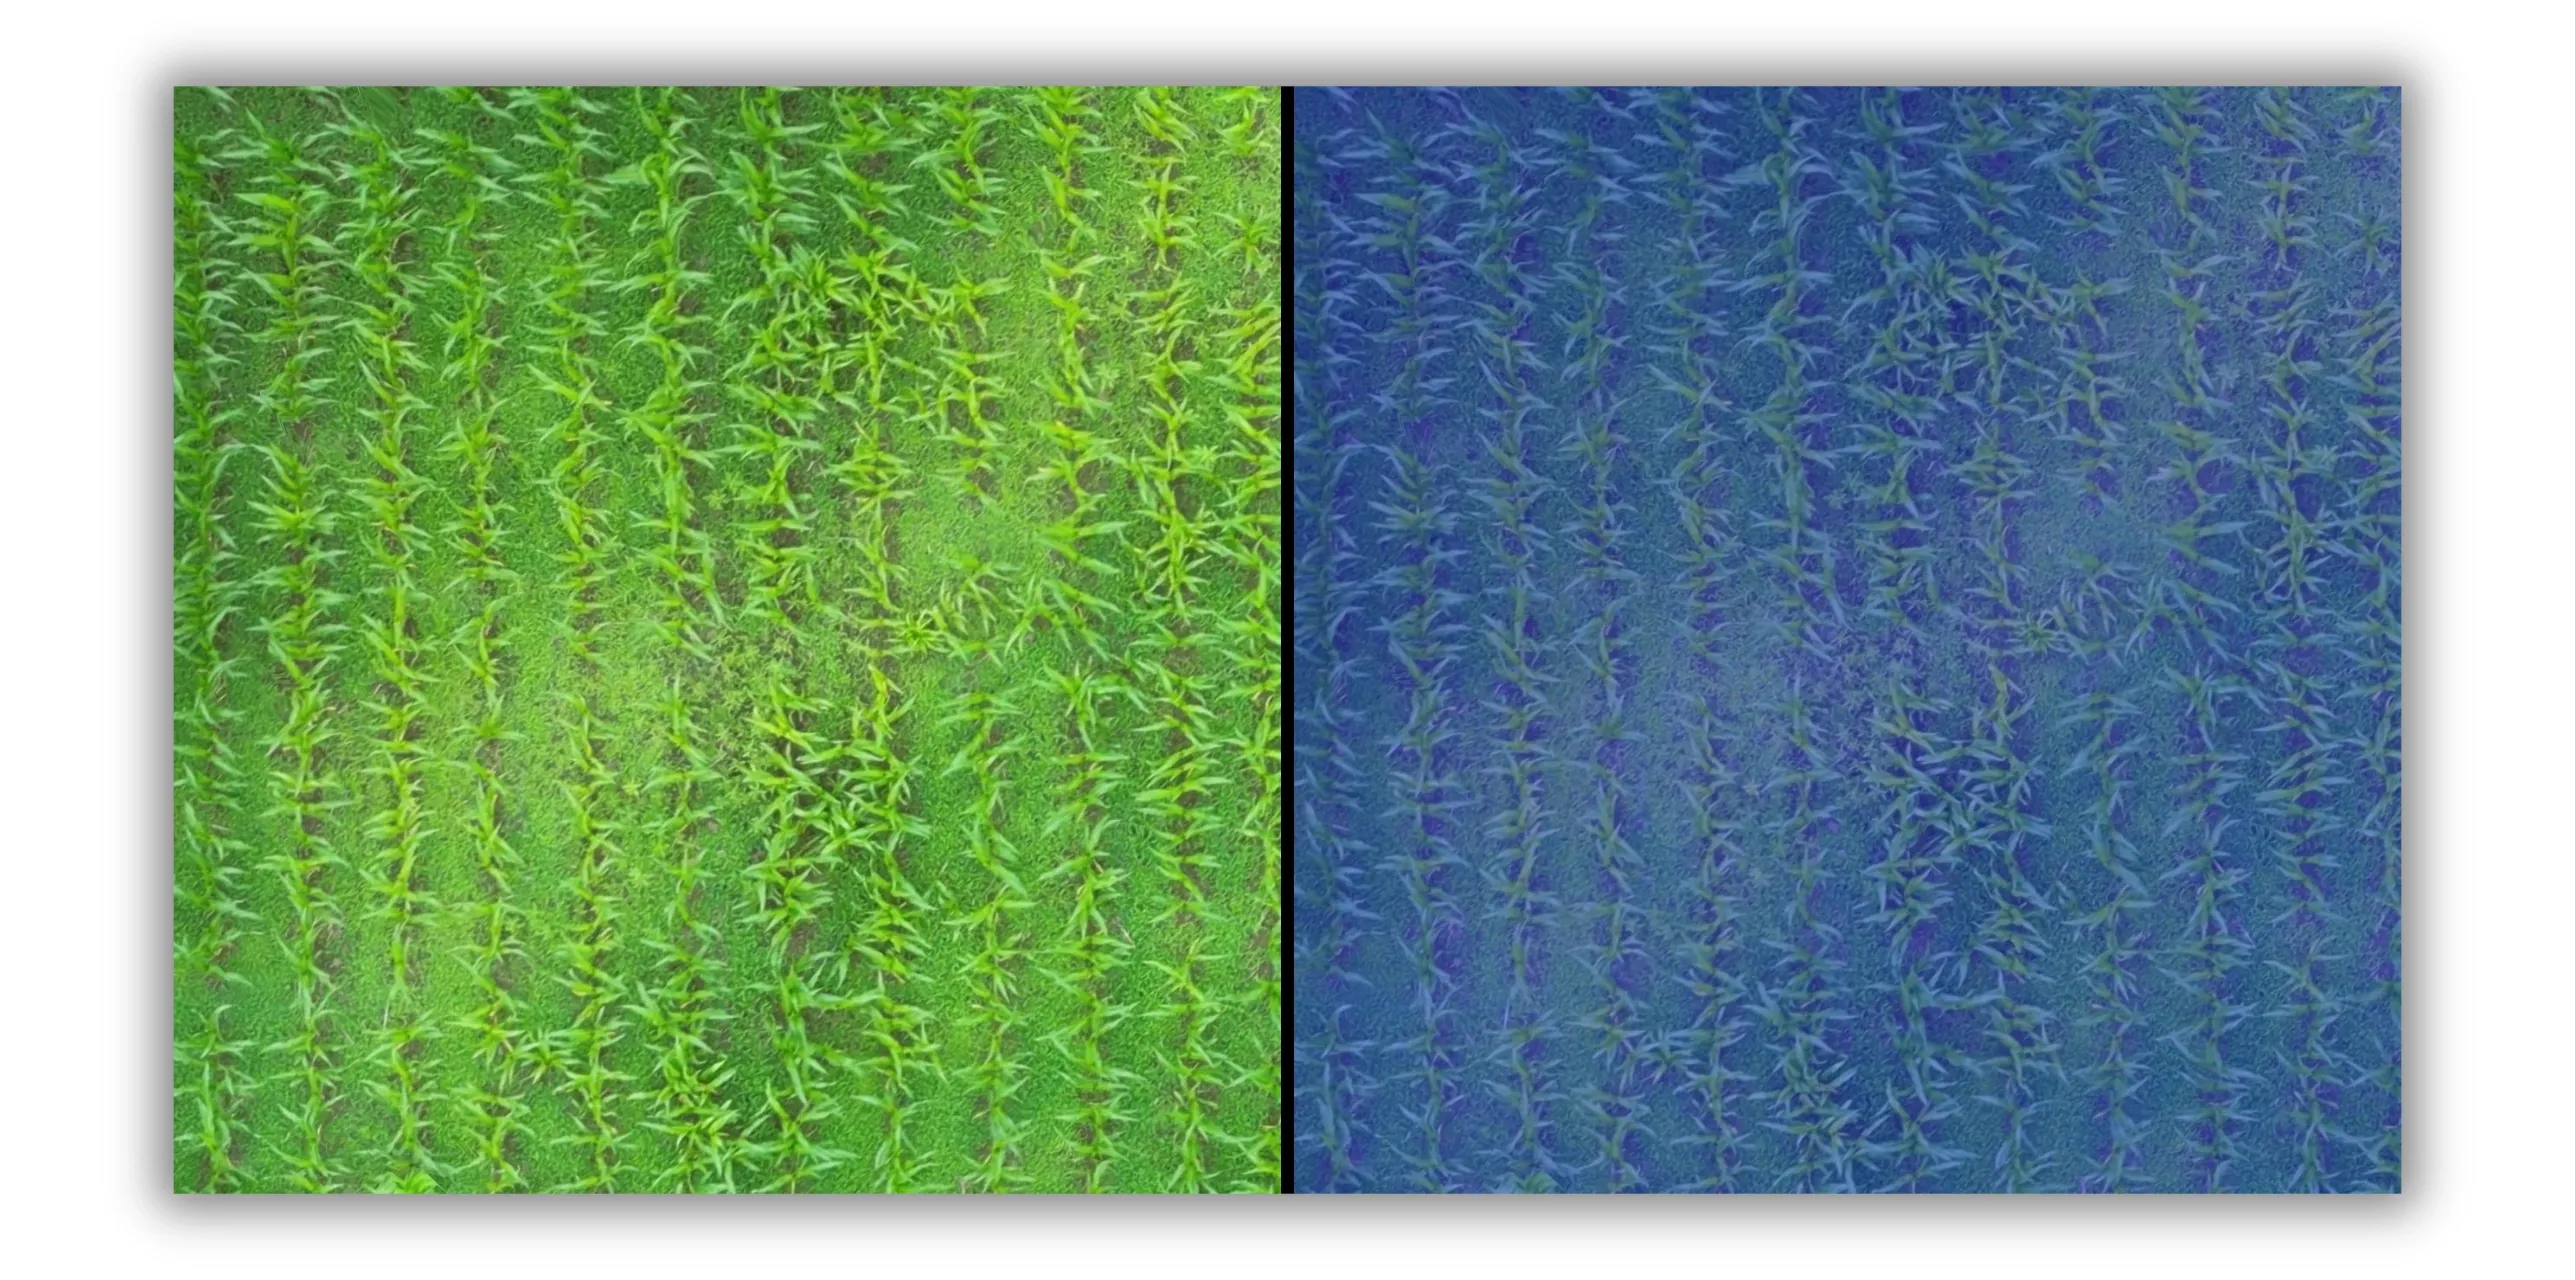
You can see our results below:
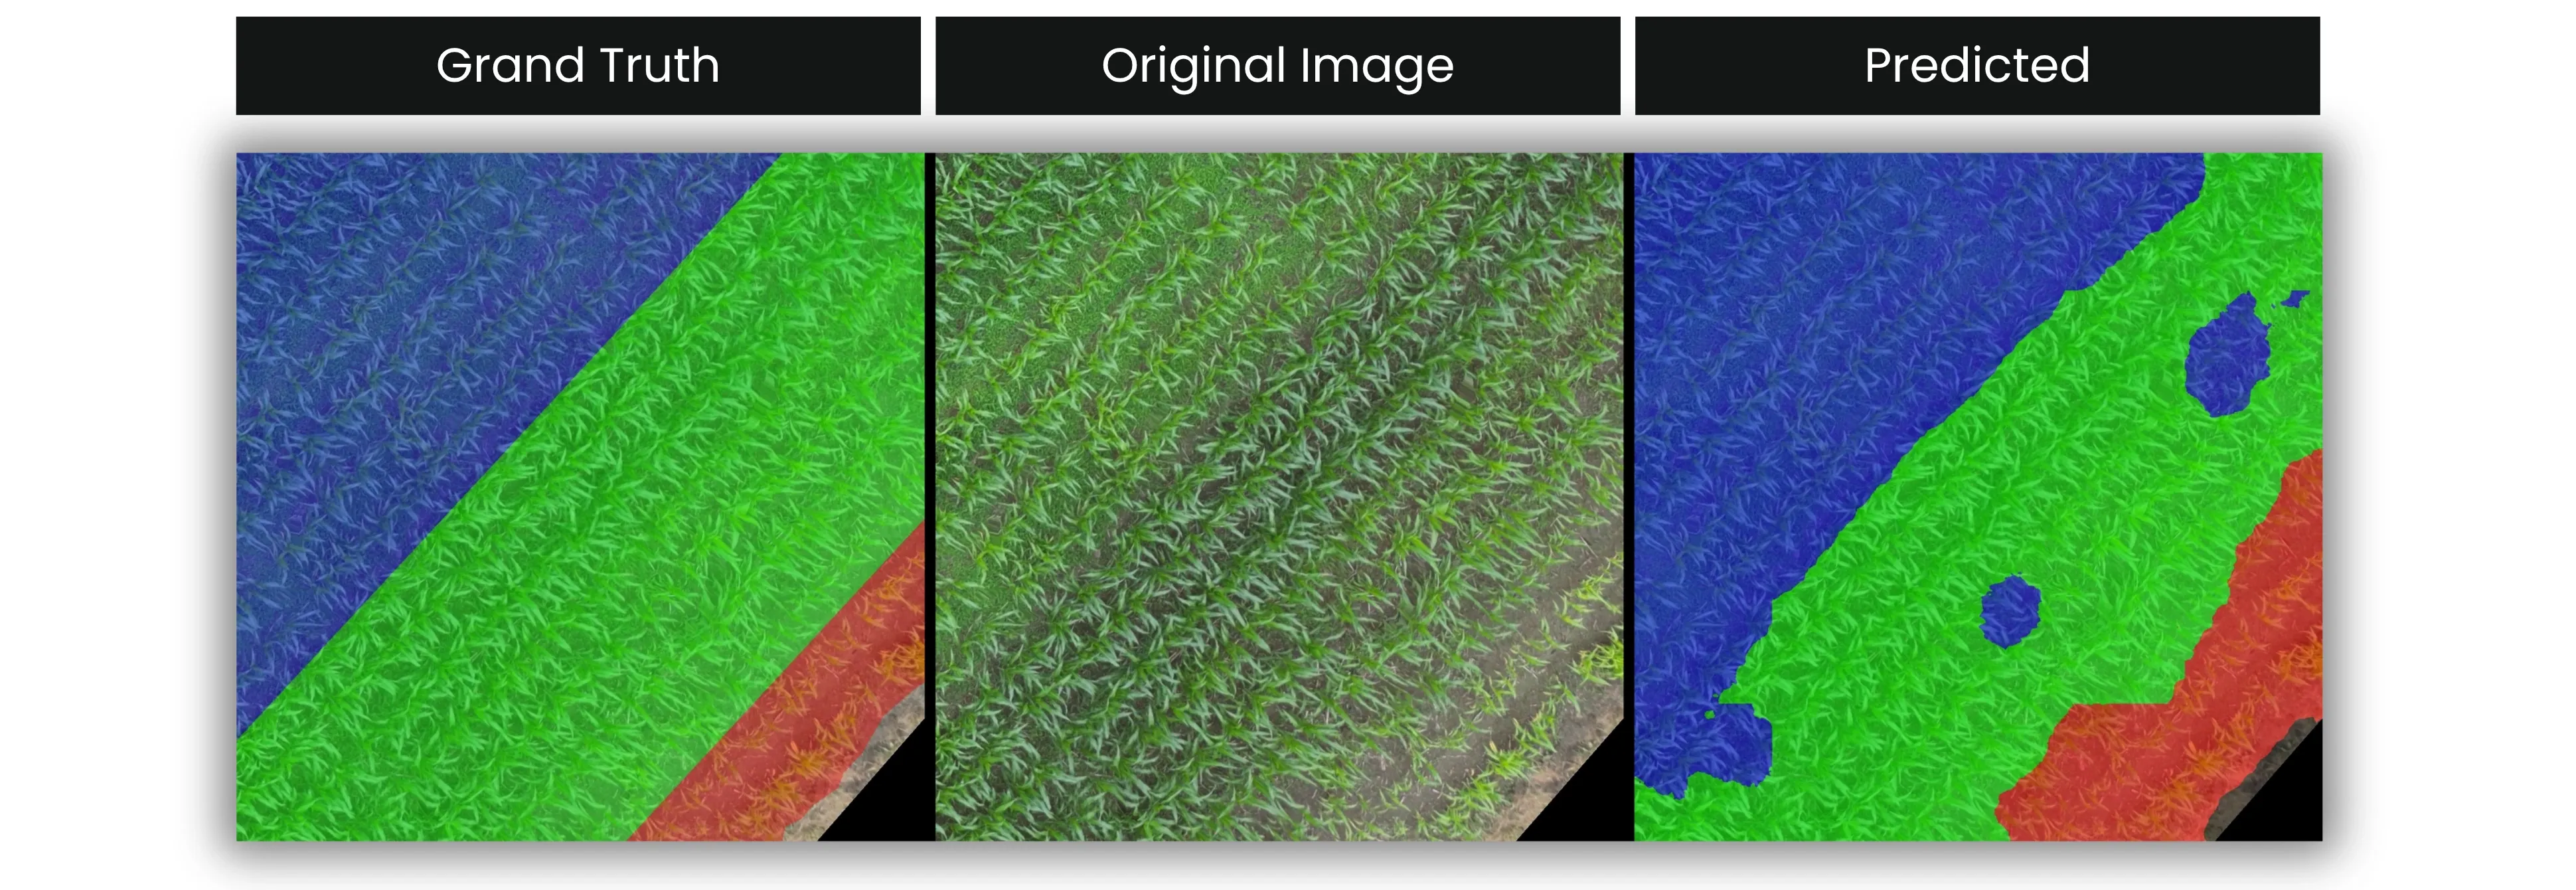
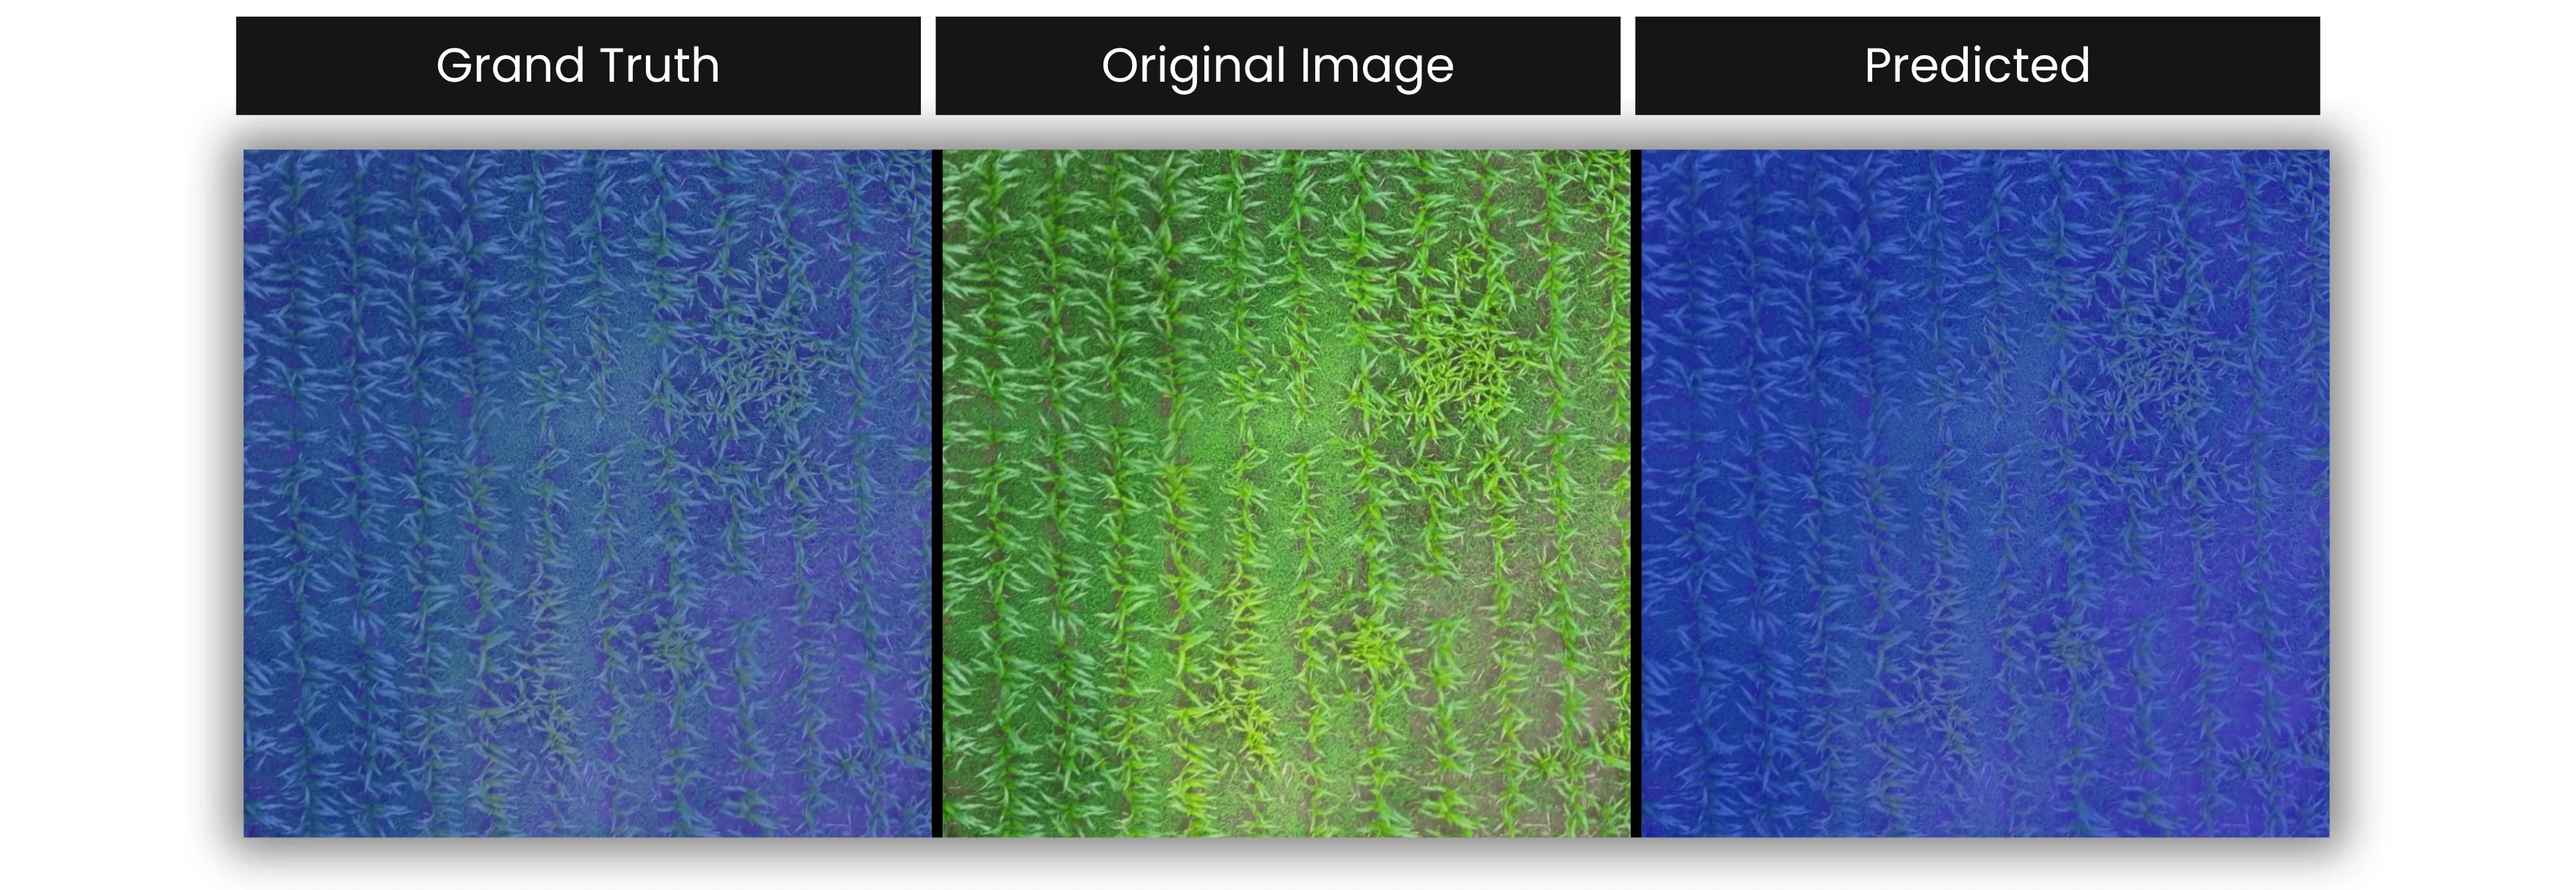
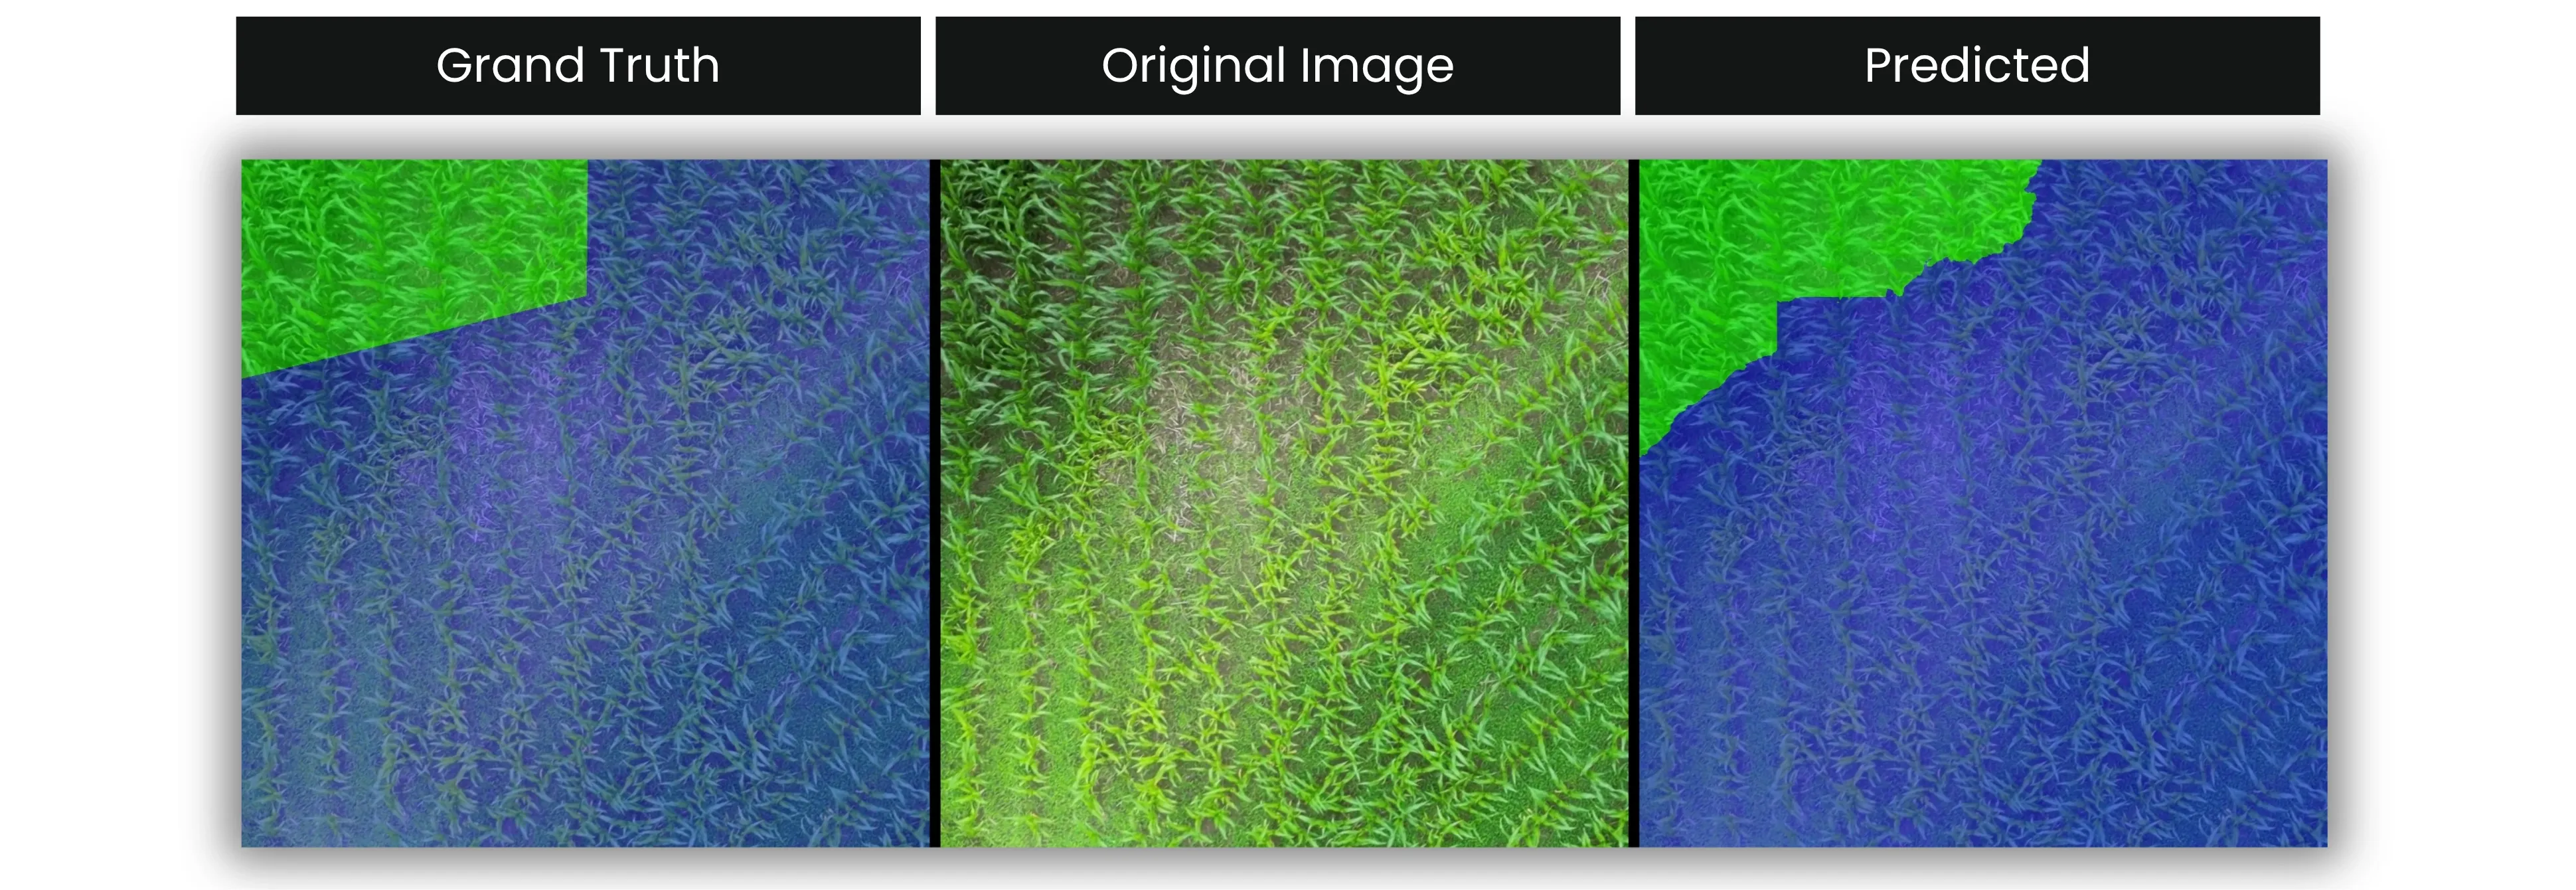
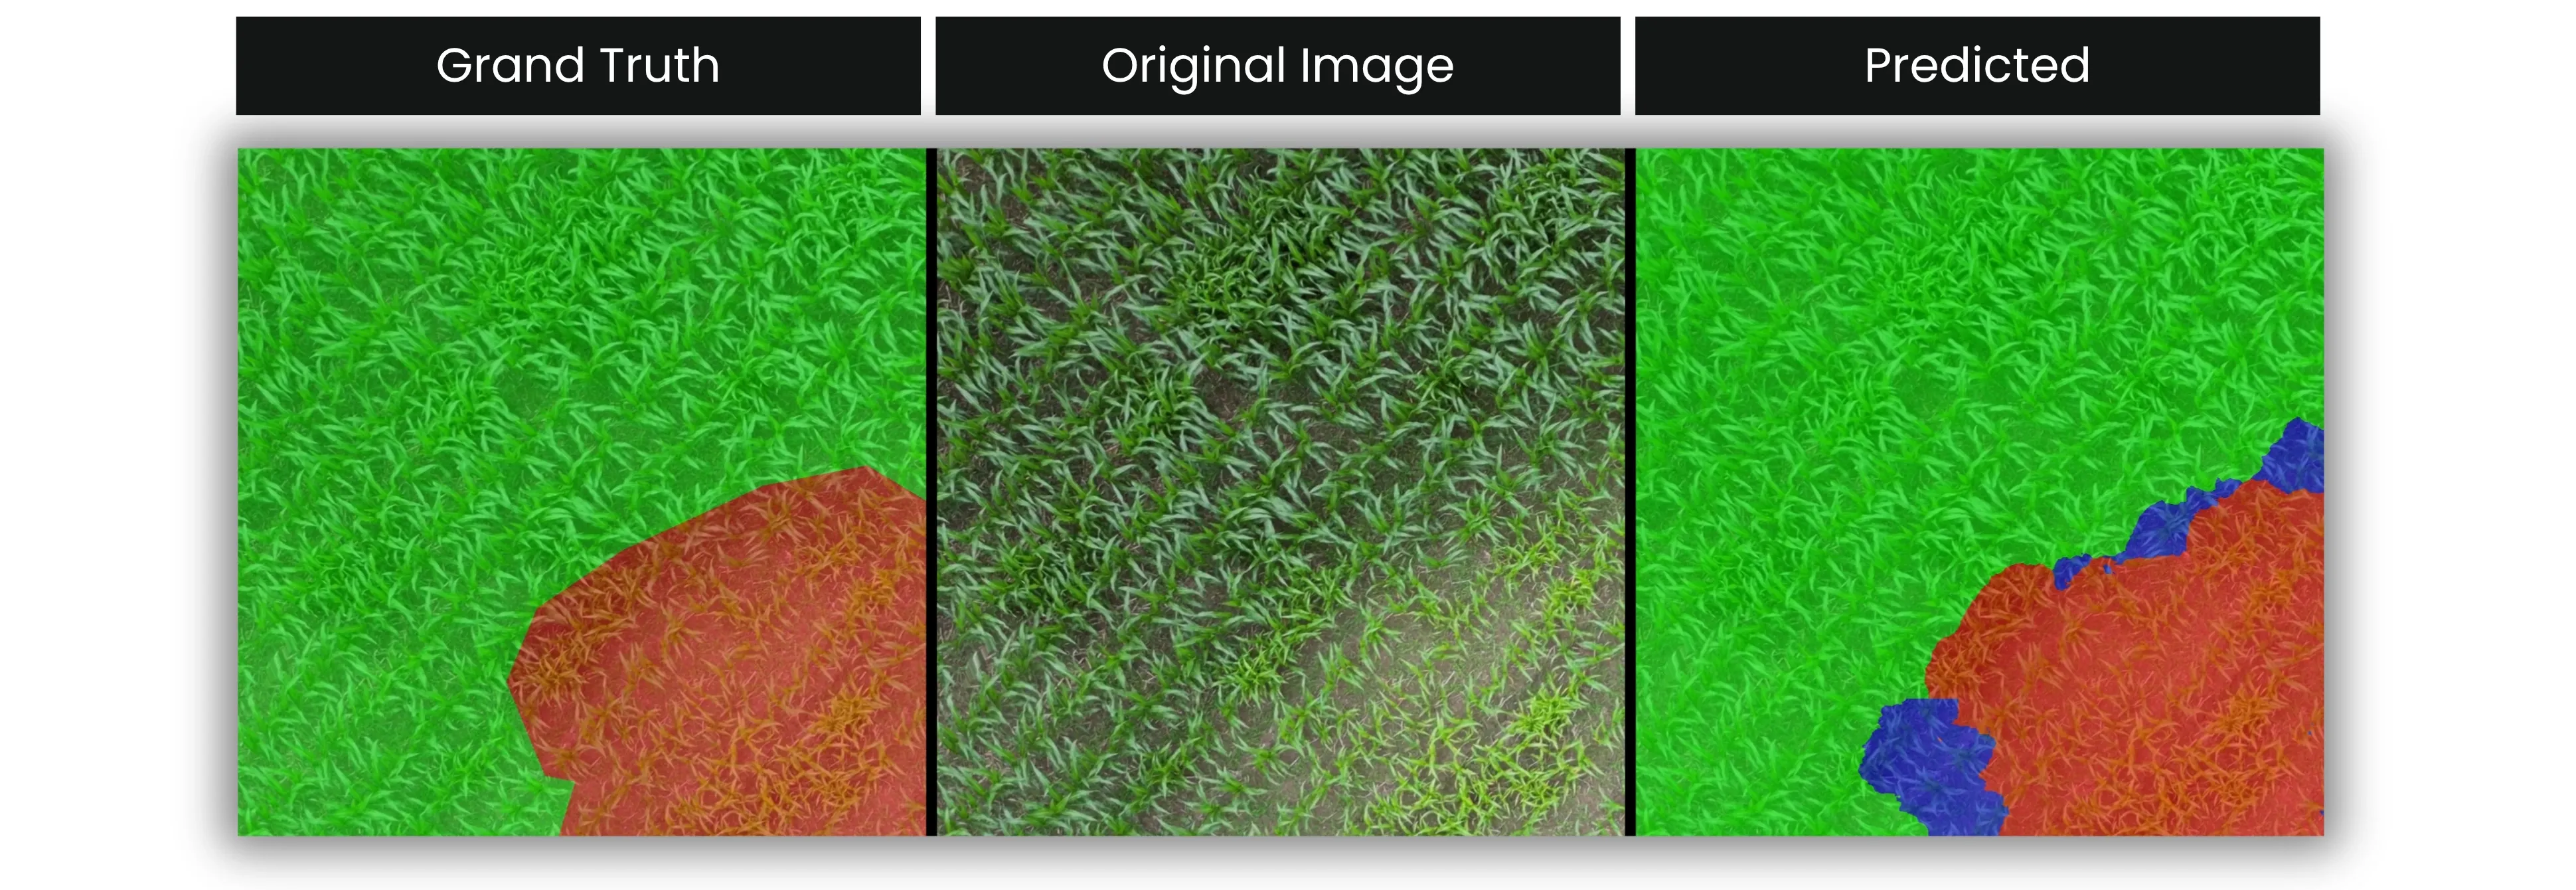
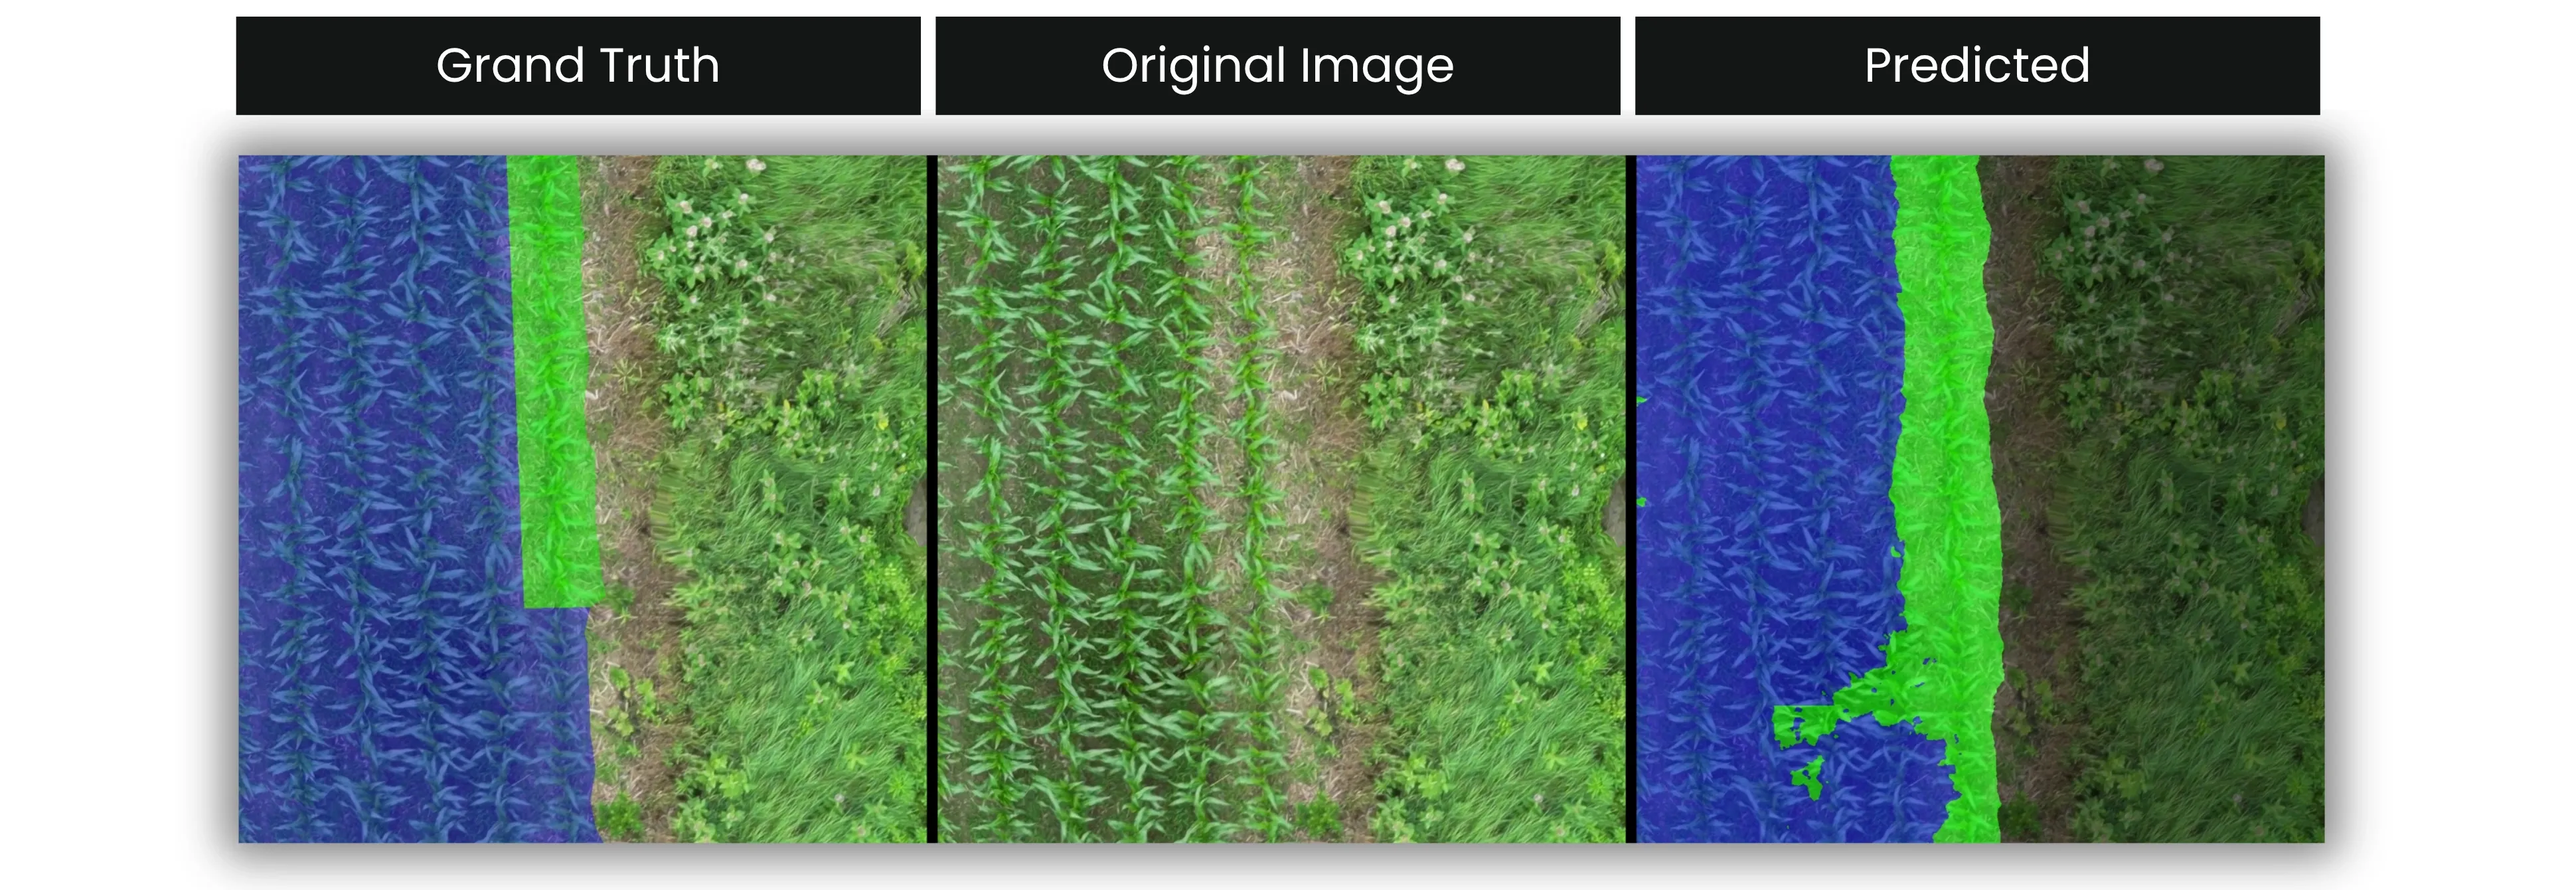
As you can see, our model was able to identify different areas of the field very well.
Future Work
In this project, stressed corn is detected using RGB images, which enables the identification of stress symptoms primarily based on visible color variations in the plants. While this approach provides a practical and cost-effective solution, it is inherently limited to stress conditions that manifest in the visible spectrum. As future work, the use of multispectral or hyperspectral imagery is proposed to enhance the detection capability of the system. Such data can capture subtle physiological changes in corn plants at earlier growth stages, even before visual symptoms become apparent. Moreover, multispectral information can help distinguish between different types of stress, such as nutrient deficiency, water stress, or disease, thereby providing deeper insight into the underlying causes of stress. Integrating these advanced imaging modalities is expected to improve both the accuracy and the interpretability of stress detection, ultimately supporting more timely and informed decision-making in precision agriculture.
Conclusion
By employing this model, farmers are able to identify areas infested with waterhemp in a significantly reduced time frame, enabling more effective planning and implementation of appropriate management and control strategies to improve both crop yield and quality. Furthermore, by distinguishing between stressed and healthy corn regions, farmers can more accurately estimate the expected final yield and make informed management decisions accordingly. In addition, storing and analyzing result images acquired at different time points allows for temporal comparisons, through which farmers can evaluate the effectiveness and efficiency of waterhemp control practices and crop management strategies aimed at reducing stress and enhancing corn quality. Such analyses facilitate evidence-based decision-making and support the selection of the most effective methods for specific field conditions.
Follow us for the latest updates
Table of Contents
No headings were found on this page.