



VRA Prescription Maps | Soil and Nutrient Map Insights
Discover how VRA Prescription Maps use AI, soil data, and drone imagery to optimize seeding, spraying, irrigation, and nutrient application in farming.
Written by Maryam
Reviewed by Boshra
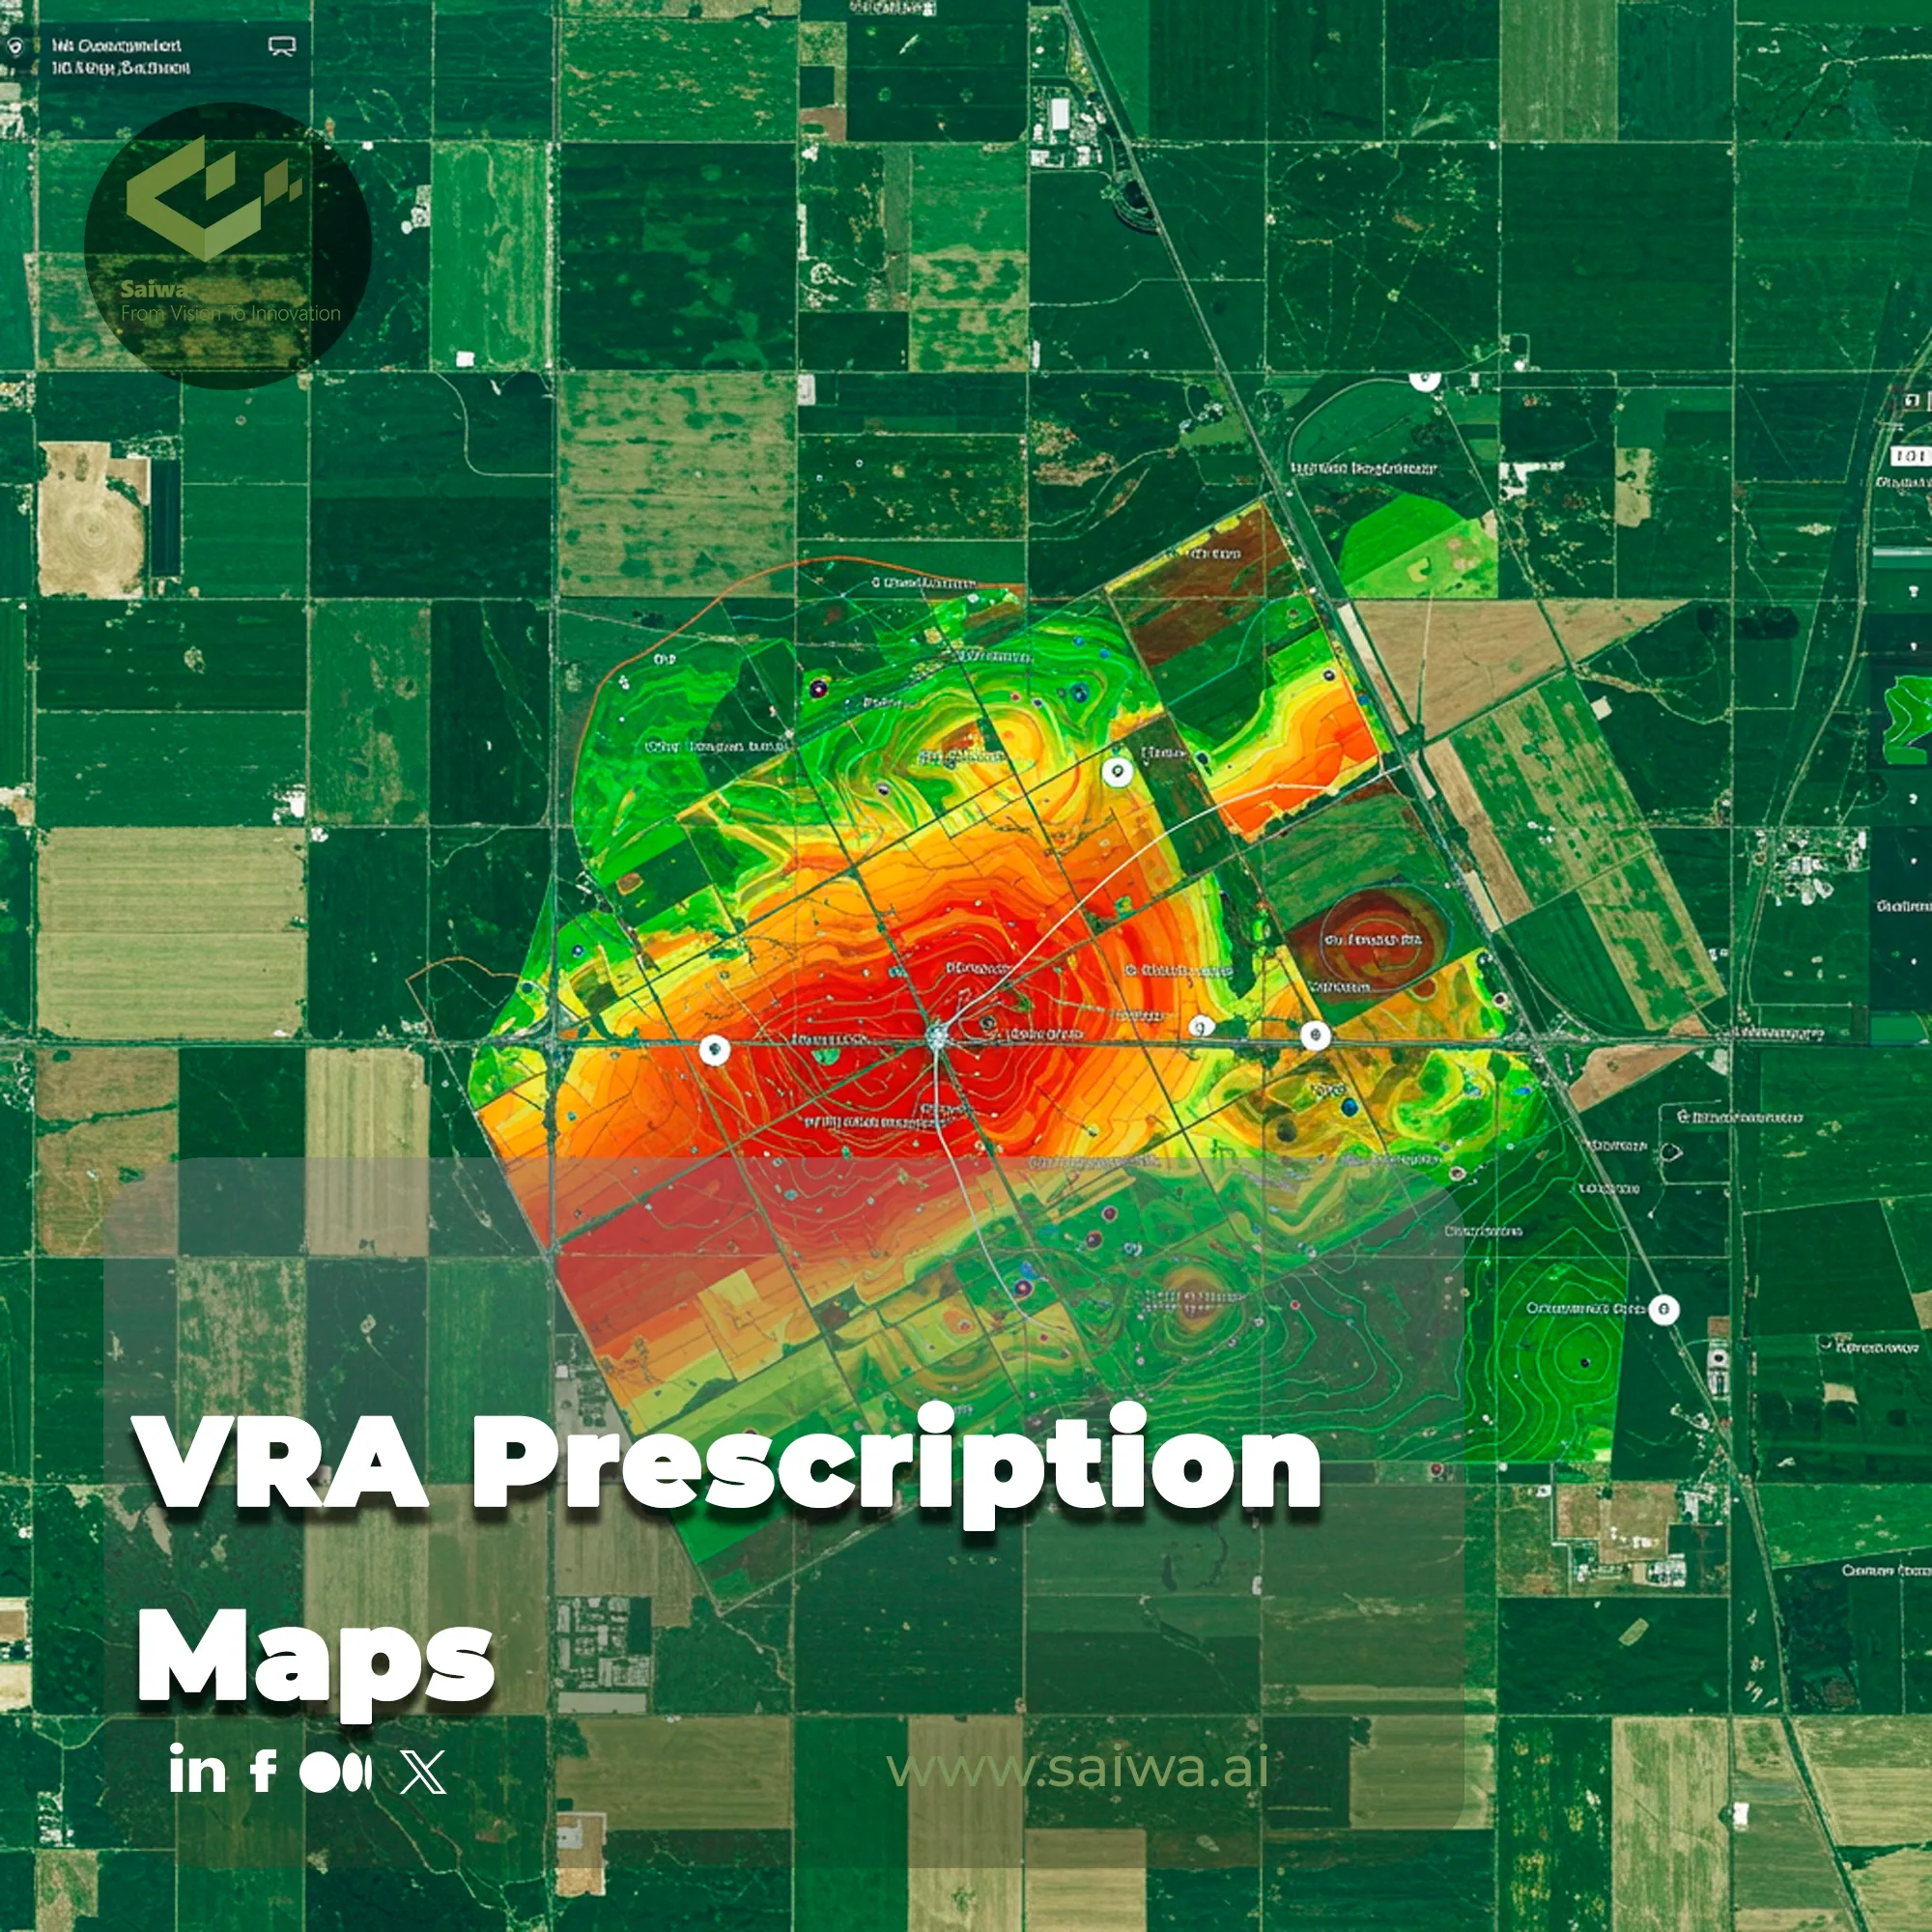
How does a tractor or sprayer intelligently adjust its application rate as it moves across a field? It follows a set of digital instructions. These instructions are contained within a VRA Prescription Map—a detailed field plan, derived from data sources like historical yield, soil analysis, and drone imagery, that assigns a specific application rate to each management zone. It acts as the brain for the machinery.
Creating such a sophisticated plan requires powerful analytical tools, which is where Saiwa’s AI platform, Sairone, comes in. This article delves into the essential elements needed to build and utilize these maps effectively.

Data Sources Behind VRA Prescription Maps
The precision of these maps hinges on the quality and diversity of the data inputs that define management zones. Synthesizing these layers is crucial for creating an accurate digital twin of the field. The most effective strategies integrate several key data streams:
Historical Yield and Productivity Zones: Analyzing past harvest data helps identify historically high and low-performing areas, forming the foundational layer for management zones.
Soil Analysis and Nutrient Maps: Grid or zone-based soil sampling provides granular data on nutrient deficiencies or surpluses (e.g., N, P, K) and properties like pH, creating a precise nutrient demand map.
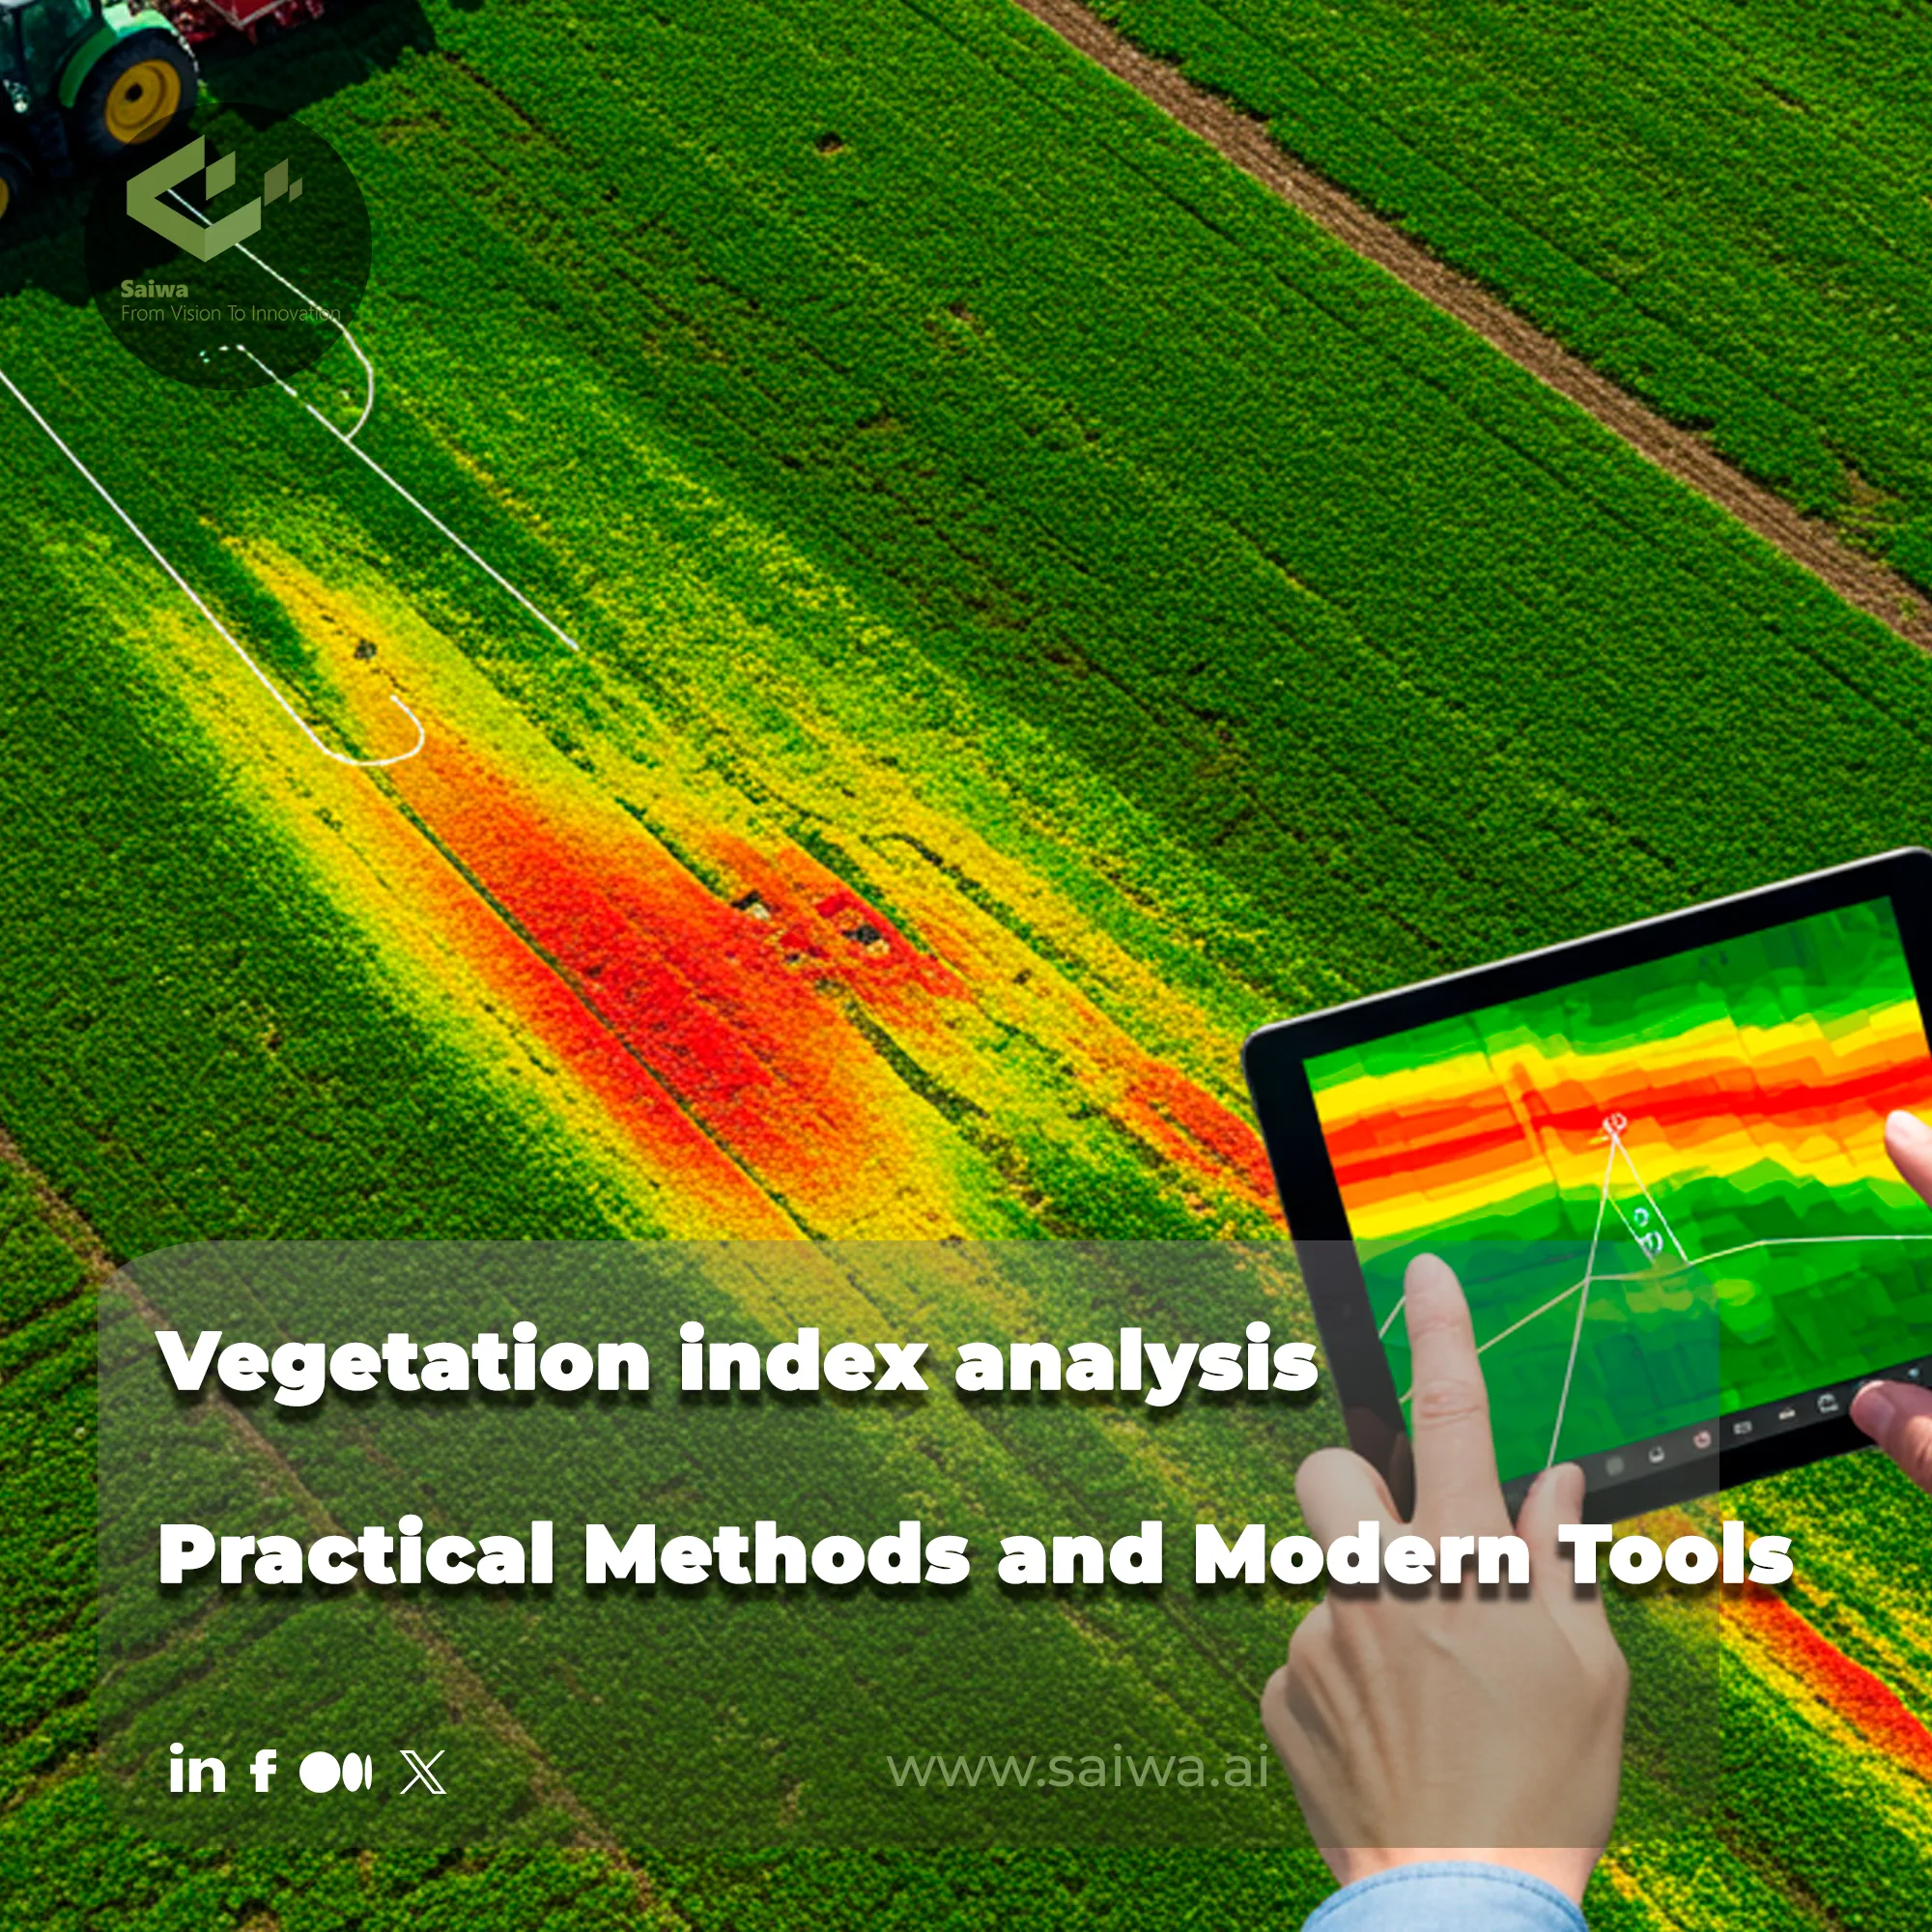
Vegetation Indices (VIs): Derived from satellite or drone imagery, Vegetation Indices analysis like NDVI and NDRE measure crop health, biomass, and stress levels in near real-time, offering a snapshot of plant vigor across the field.
Topography and Terrain Data: Elevation maps are critical as they influence soil moisture, nutrient runoff, and sun exposure, directly impacting crop performance.

Practical Applications of VRA Prescription Maps
This granular data unlocks several high-impact applications on the farm, each targeting a specific operational inefficiency. These applications allow for the surgical placement of inputs, maximizing their effectiveness while minimizing cost and environmental impact.
Fertilizer Application and Nutrient Management
This is the primary use case, where fertilizer is applied at varying rates to match the specific nutrient requirements of each management zone, preventing waste and ensuring optimal crop nutrition.
Seeding Rate Optimization
VRA enables farmers to vary seeding density across a field. Higher rates are used in high-potential zones to maximize yield, while lower rates are used in less productive areas to save on seed costs.
Pesticides and Spot Spraying
Advanced VRA prescription maps are used for targeted pesticide and herbicide application. By integrating AI-powered weed detection, platforms like Sairone can generate maps for spot spraying, where drones only treat infested patches, drastically reducing chemical usage.
Irrigation and Crop Protection
By using indices like the Normalized Difference Moisture Index (NDMI), VRA systems can manage irrigation, delivering more water to zones identified as water-stressed and less to areas with adequate moisture.
Read Also : Machine Learning in Environmental Science - A Sustainable Future
Types of VRA Prescription Maps
VRA maps can be tailored for different operations depending on farm needs: seeding, fertilization, pesticides, irrigation, or soil amendments. Each type focuses on optimizing a specific input, ensuring resources are applied where they are most needed.
1. Seeding / Sowing Maps
Adjust planting density across field zones based on soil fertility, past yields, or crop health, ensuring optimal plant populations and maximizing yield potential.
2. Fertilization Maps
Apply nutrients variably according to soil nutrient levels and crop requirements. This prevents over-application in low-demand areas and ensures high-productivity zones get the nutrients they need.
3. Pesticide & Herbicide Maps
Target specific areas with pest or weed infestations, reducing chemical usage and minimizing environmental impact.
4. Irrigation Maps
Deliver water precisely where it’s needed, conserving resources and avoiding overwatering or water stress in different zones.
5. Soil Amendment Maps
Adjust applications of lime, gypsum, or other soil amendments per zone to optimize pH and soil properties for better crop performance.
By categorizing VRA maps this way, farmers can understand the purpose of each map type before diving into specific operational applications.
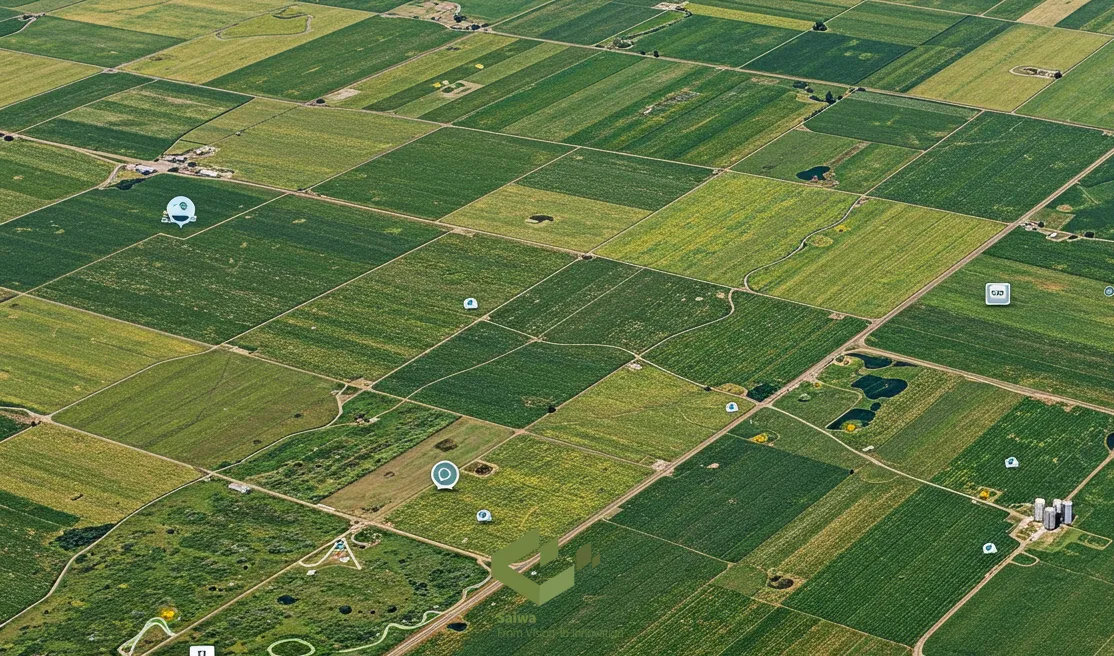
Role of AI Advanced Technologies in VRA Mapping
Artificial intelligence elevates VRA from a data-heavy process to a smart, automated workflow. AI algorithms can analyze complex datasets far more effectively than traditional methods, revealing deeper insights for better decision-making.
AI-Derived Prescription Zones
AI models process multiple data layers simultaneously to create dynamic and highly accurate management zones. Instead of relying on a single data point, the AI integrates soil, terrain, and vegetation data for a holistic field view.
Smart Drone Integration
Platforms now seamlessly connect analysis software with hardware, such as XAG spray drones. This ensures that the generated prescription file (e.g., SHP, JSON) is perfectly compatible with the application equipment for flawless execution.
Multi-Sensor Data and Vegetation Indices
AI excels at interpreting data from advanced multispectral sensors (with 15 or more bands), enabling sophisticated crop yield estimation and early stress detection long before it becomes visible to the human eye.
Automated Reporting and Decision Support
Modern AI systems don't just create maps; they interpret them. Features like PIX4Dfields' AI crop growth report synthesize NDVI maps, weather data, and soil conditions to provide farmers with clear, actionable text-based summaries.
Validating a VRA Prescription Map Before Application
A VRA prescription map is only valuable if the management zones and rate instructions are accurate enough to improve field decisions in practice. The article already makes clear that these maps act as digital instructions for equipment and are built from multiple data sources such as yield history, soil analysis, vegetation indices, and terrain layers, which means map quality depends directly on the quality of the underlying inputs.
For professional growers, the real question is not whether a map looks detailed, but whether each zone reflects a meaningful agronomic difference that justifies a different seeding, fertilizer, irrigation, or crop-protection rate.
Match the layer to the decision
Not every data layer is equally reliable for every type of prescription. Historical yield, productivity zones, and soil analysis are foundational for defining stable management zones, while vegetation indices and drone imagery are more useful for capturing current-season variability and stress patterns.
That distinction matters because a map built for variable-rate fertilizer should not be interpreted the same way as one built for spot spraying or irrigation control. The current article already separates these applications clearly, which is a useful reminder that each map type needs its own validation logic before export.
For nitrogen-related prescriptions, this point becomes even more important. A 2025 study summarized by USGS found that multispectral red-edge indices were effective for estimating crop nitrogen content, but were poor predictors of nitrogen concentration, showing that a spectral layer can be strong for one agronomic purpose and weak for another.
In practical terms, growers should confirm that the indicator used in the map actually matches the decision being made, instead of assuming that every vegetation map is equally suitable for every nutrient recommendation.
Check execution readiness before export
Once the agronomic logic is sound, the next step is operational readiness. The article notes that modern systems can connect directly with equipment and generate compatible prescription files such as SHP or JSON, while Sairone’s crop health workflow also supports prescription-map export for spray drones or precision sprayers using formats such as shapefiles and KML.
That means validation should include more than agronomy alone. It should also confirm that rate classes, zone boundaries, and file formats match the controller, drone, or sprayer that will execute the job.
Map type | Best supporting layers | What to verify before export |
Seeding map | Historical yield zones, soil analysis, and topography. | Check that population shifts follow stable productivity patterns rather than temporary in-season noise. |
Fertilizer map | Soil nutrient data, vegetation indices, and crop-demand patterns. | Confirm the nutrient indicator matches the recommendation goal, especially for nitrogen. |
Pesticide or herbicide map | AI-based weed or stress detection from drone imagery. | Verify hotspots with scouting before converting detection into treatment zones. |
Irrigation map | NDMI, terrain, and water-stress indicators. | Make sure water-delivery zones align with actual irrigation system capability. |
Use feedback to improve the next map
The strongest VRA workflows do not end when the file is uploaded. Sairone’s crop health system is built around localized alerts, a health dashboard, and a growing-season timeline, which supports a more complete cycle of planning, treatment, tracking, and improvement.
That feedback loop matters because prescription maps should be refined with post-application results, not treated as one-time outputs. If a treatment zone underperforms or a rate class proves too aggressive, that outcome should shape the next round of zoning and recommendation logic.
In other words, the best prescription map is not the most colorful one. It is the one that connects the right data layer to the right agronomic decision, runs cleanly on the target equipment, and improves with each pass across the field.
Sairone: AI-Powered Insights for Smarter Decisions
At Saiwa, we built Sairone to master this very challenge. Sairone leverages advanced AI to analyze high-resolution drone imagery, delivering precise, actionable insights for weed and pest detection, plant health monitoring, and yield analysis. Instead of just providing raw data, Sairone translates complex visual information into clear, data-driven directives that integrate directly into your precision agriculture workflow, turning insights into action.
Conclusion
The shift from uniform field management to precision agriculture represents a critical evolution in modern farming. By leveraging multiple data sources and the analytical power of AI, VRA prescription technology moves beyond simple mapping to become a comprehensive decision-making tool. This approach not only optimizes input efficiency and boosts yields but also fosters a more sustainable and profitable future for agriculture.
Note: Some visuals on this blog post were generated using AI tools.
About the team
Continue reading
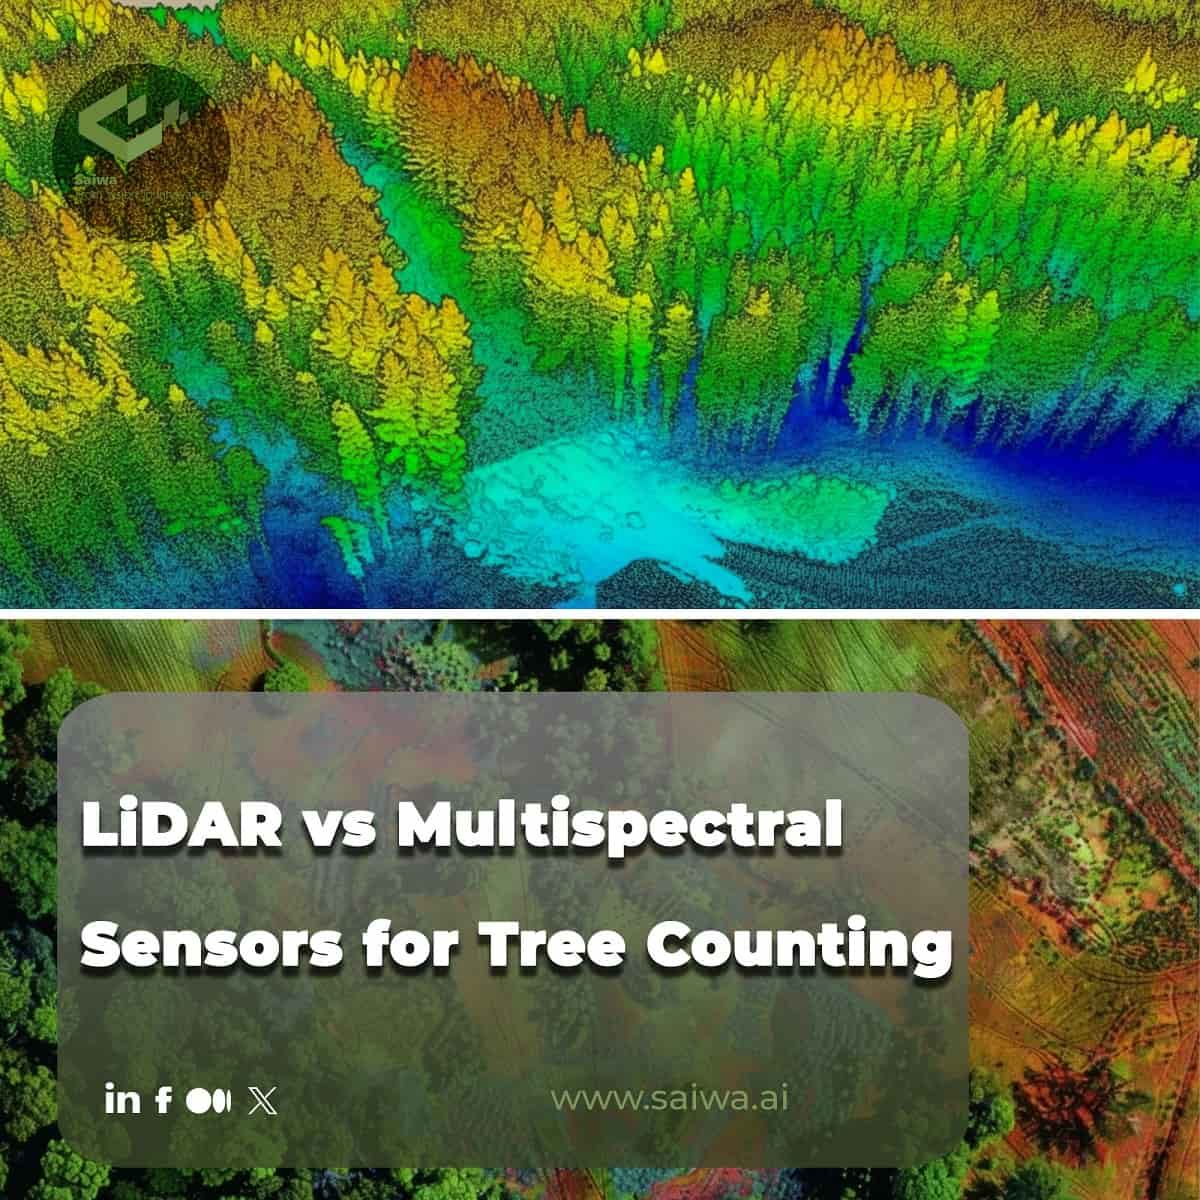
LiDAR vs Multispectral Sensors for Tree Counting
Recent advances in unmanned aerial vehicles (UAVs) and remote sensing technologies have significantly expanded the capabilities of tree dete
Methods of Tree Counting: A Practical Guide on Using AI
Counting trees is an important part of forestry and environmental science. It provides key information that is needed to assess forest resou

Gallant Soldier Control: Threats, Technologies, and How Sairone Leads the Way
Why Gallant Soldier Control MattersGalinsoga parviflora, or Gallant Soldier, is an aggressive invasive weed that poses a significant agronom

Methane Emission Monitoring Using Drones
Methane, a potent greenhouse gas, represents a significant threat to the global climate. The accurate monitoring and mitigation of methane e
Vegetation index analysis - Practical Methods and Modern Tools
Monitoring the health of our planet’s vegetation, from vast forests to individual crops, is a critical challenge. Remote sensing offers a po

Satellite and Drone Imagery | A Comparative Analysis
The ability to observe and analyze the Earth from afar has revolutionized numerous fields, including geography, environmental science, and r
Comments
Be the first to share your thoughts
No comments yet
Start the conversation by sharing your thoughts
Share this article
Help others discover this content
Table of Contents
No headings were found on this page.