


Vegetation index analysis - Practical Methods and Modern Tools
Discover key vegetation indices like NDVI and EVI used in remote sensing to monitor plant health, growth, and ecosystems.
Written by Amirhossein
Reviewed by Boshra
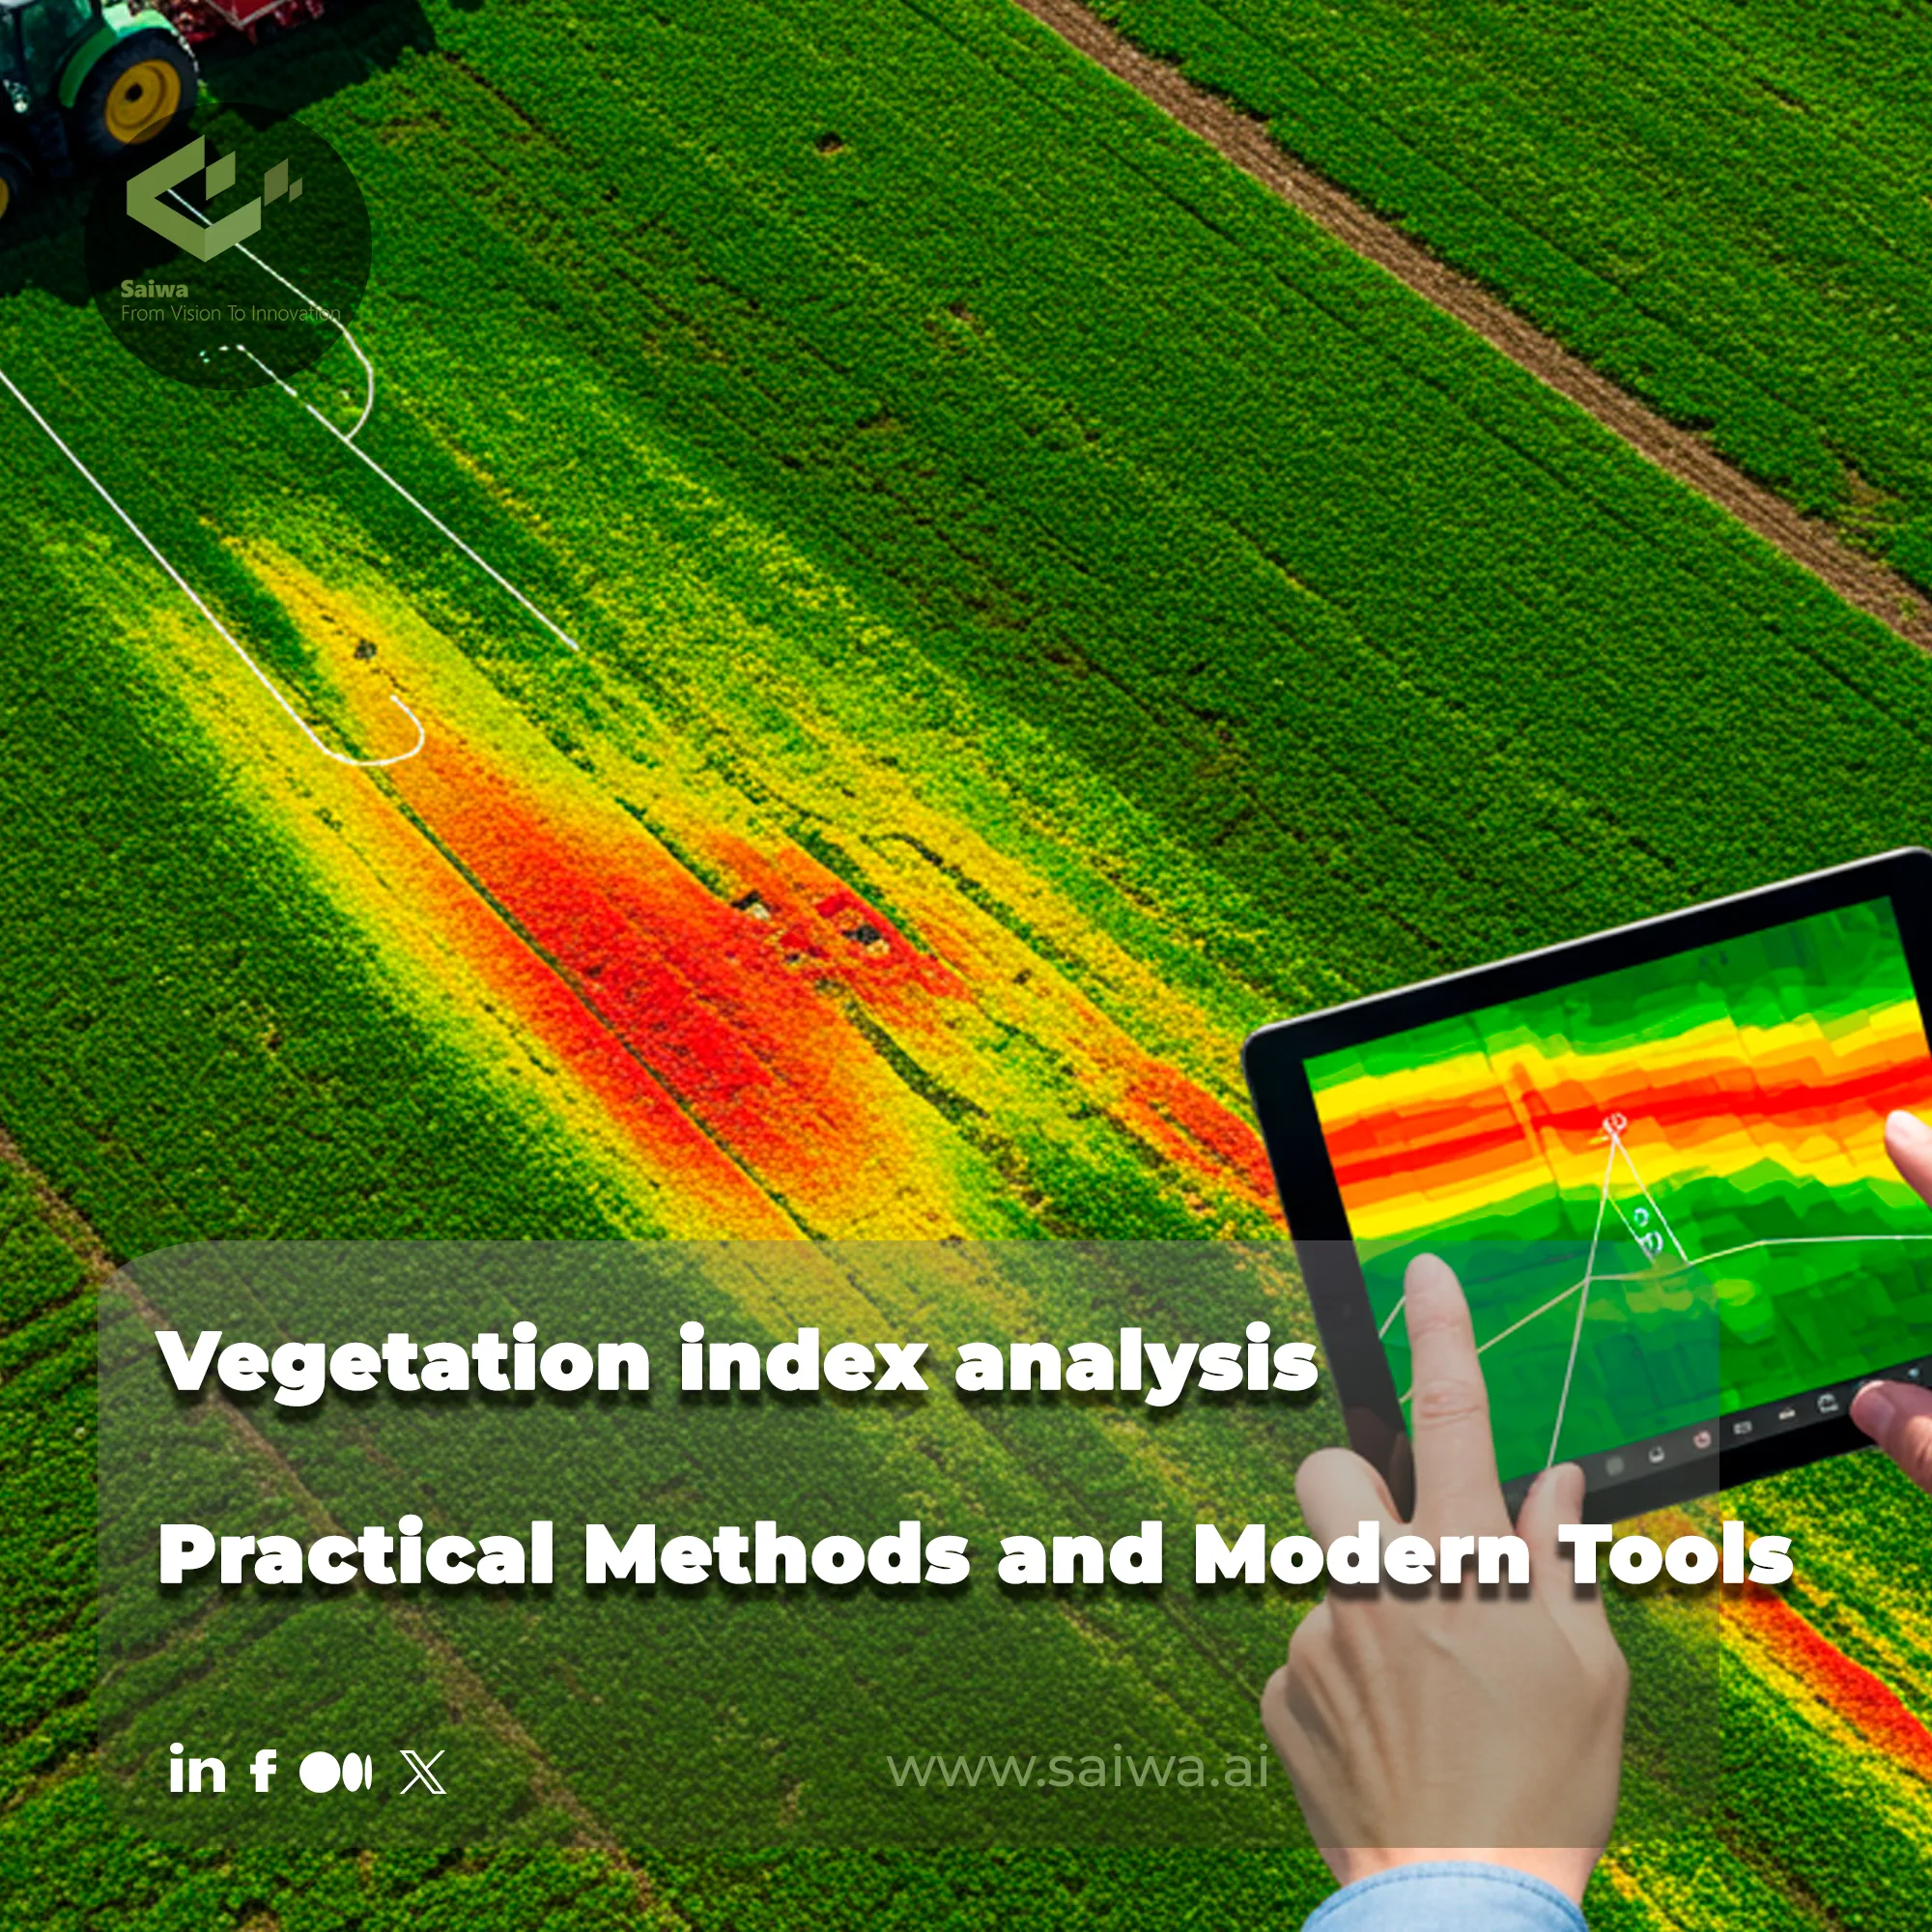
Monitoring the health of our planet’s vegetation, from vast forests to individual crops, is a critical challenge. Remote sensing offers a powerful solution, moving beyond simple observation to quantitative assessment. At the heart of this evolution lies the ability to translate spectral data into meaningful metrics of plant vigor.
This article explores the core methods and modern tools transforming this field. We will delve into foundational indices, their practical applications, and how advanced AI platforms like Saiwa’s Sairone are revolutionizing this domain by delivering actionable, data-driven insights.

Core Vegetation Indices Explained
Vegetation indices are mathematical combinations of different spectral bands, designed to highlight the properties of healthy or stressed vegetation while minimizing external factors like soil brightness. To appreciate their power, let's explore four foundational indices that form the bedrock of remote sensing in agriculture and ecology. Each offers a unique lens through which we can view plant life.
NDVI (Normalized Difference Vegetation Index)
The most well-known index, NDVI, provides a robust measure of general greenness. It contrasts the strong absorption of red light by chlorophyll with the high reflectance of near-infrared (NIR) light by plant cellular structures. However, it can become saturated in very dense canopies, losing sensitivity.
EVI (Enhanced Vegetation Index)
Developed to overcome NDVI’s limitations, EVI incorporates a blue band to correct for atmospheric aerosols and reduces the influence of the soil background. This makes it more reliable for analyzing areas with high biomass, such as dense forests.
SAVI (Soil-Adjusted Vegetation Index)
In sparsely vegetated areas, the reflectance from bare soil can distort NDVI values. SAVI addresses this by introducing a soil brightness correction factor (L), making it ideal for arid regions or monitoring early-stage crop growth.
NDRE (Normalized Difference Red Edge)
NDRE utilizes the "red edge" band, which penetrates deeper into the plant canopy than red light. This makes it exceptionally sensitive to chlorophyll content in mid-to-late-stage crops, offering valuable insights into nitrogen levels and stress.
How to Choose the Right Vegetation Index
A vegetation index is only useful when it matches the agronomic question being asked. The current article correctly explains that different indices were designed to reduce specific problems such as soil brightness, atmospheric interference, canopy saturation, or limited chlorophyll sensitivity, which means no single index should be treated as a universal default.
Why NDVI is not always enough
NDVI remains the most widely used index because it is simple, interpretable, and effective for measuring general canopy greenness. At the same time, peer-reviewed review work notes that NDVI has known limitations in dense vegetation, bright-soil conditions, and atmospherically noisy scenes, which is why many alternative indices were developed in the first place.
That distinction matters in professional crop monitoring. A field with sparse early growth, a dense mid-season canopy, and a nitrogen-sensitive management objective should not be analyzed with the same index logic at every stage.
The 2025 Sensors review also emphasizes that many vegetation indices are correlated with NDVI, but meaningful differences still emerge depending on landscape and application context. In other words, some indices may look similar statistically while still providing more useful discrimination for a specific crop-monitoring task.
Match the index to the field condition
The most reliable way to use vegetation indices is to tie them to crop stage and decision purpose. The current article already points toward that logic by noting that SAVI is better in sparse vegetation, EVI performs better in high biomass, and NDRE is especially useful for mid- to late-stage chlorophyll and nitrogen interpretation.
Field condition or goal | Best-fit index | Why it fits |
Early growth with visible soil background | SAVI | SAVI includes a soil brightness correction factor, making it more dependable when bare soil strongly affects reflectance. |
General crop vigor monitoring | NDVI | NDVI is still a strong baseline for whole-field greenness and broad vegetation assessment. [1] |
Dense or high-biomass canopy | EVI | EVI was designed to reduce saturation and improve performance where NDVI becomes less sensitive. |
Mid- to late-season nitrogen or chlorophyll tracking | NDRE | NDRE uses the red-edge region, which penetrates deeper into the canopy and is more sensitive to chlorophyll-related stress in developed crops. |
RGB-only workflows where NIR is unavailable | VARI | VARI was designed to estimate greenness using visible bands only and can be useful when NIR data is not available. |
Think in combinations, not single maps
The strongest monitoring workflows rarely rely on one index alone. The current article already points toward this future direction by highlighting hyperspectral methods, machine learning-generated indices, and integration with LiDAR and radar.
That broader approach is also supported by the review literature, which notes that vegetation-index performance is highly context-sensitive and that environmental variability, terrain type, sensor characteristics, and phenological stage all influence how well an index works in practice.
For growers and ag-service providers, that means one map should trigger a question, not end the investigation. If NDVI flags a low-vigor zone, the next step may be NDRE for chlorophyll sensitivity, EVI for dense-canopy interpretation, or field validation to distinguish nutrient stress from water or disease pressure.
Turning index maps into decisions
This is where platforms such as Sairone become more useful than index calculation alone. Sairone’s crop health workflow supports plant health indices, localized alerts, health dashboards, and prescription-map export, which helps users move from spectral interpretation to treatment planning.
The practical takeaway is simple: the best vegetation index is not the most popular one. It is the one that answers the specific field question with the least ambiguity at that stage of the crop cycle.
Data Source Comparison for Vegetation Index Analysis
Vegetation indices can be calculated from multiple data sources, each with unique strengths and limitations. Choosing the right source depends on your crop type, field size, required frequency, and budget.
Data Source | Pros | Cons | Best Use Cases |
Satellite Imagery (e.g., Sentinel-2, Landsat, MODIS) | Wide coverage, frequent revisit, often free; standardized | Lower spatial resolution (10–30 m), cloud interference, may miss small-scale issues | Large fields, regional monitoring, long-term trend analysis |
Drone / UAV Imagery | High-resolution (cm-level), flexible timing, can capture specific zones | Expensive equipment, requires flight planning, limited area per flight | Detailed field-level scouting, early stress detection, pest/nutrient hotspots |
Ground Sensors / Handheld Devices | Accurate, real-time, direct measurement | Labor-intensive, limited spatial coverage, costly to scale | Small plots, validation of remote sensing data, precision monitoring of specific zones |
Manned Aircraft / Light Planes | High-resolution over larger areas than drones, faster than ground surveys | Very expensive, less flexible, requires pilots | Large estates, commercial farms, scouting before critical growth stages |
Public / Commercial APIs (e.g., Planet Labs, EOS, Google Earth Engine) | Access to processed vegetation indices, scalable, historical archives | Subscription costs, limited customization, dependent on provider data quality | Trend analysis, comparative studies, predictive modeling |
Advanced Techniques and Emerging Trends
The field is rapidly advancing beyond standard formulas. These innovations provide deeper, more nuanced insights. Let’s examine three key trends shaping the future of Vegetation index analysis.
Hyperspectral and Narrow Band Indices
Unlike multispectral sensors, hyperspectral imaging captures data across hundreds of narrow bands. This allows for the creation of highly specific indices to detect subtle stressors, water content, or even particular plant diseases with greater precision.
Machine Learning Generated Indices
Modern approaches use AI to create custom indices optimized for specific tasks. Instead of relying on predefined formulas, machine learning models analyze the data to find the most effective spectral combinations for challenges like species identification or yield prediction.
Integration with Other Data Sources
For a holistic view, index data is increasingly fused with other technologies. Combining it with LiDAR provides 3D structural information, while integration with radar can penetrate clouds, offering a more complete and resilient monitoring system.
Revolutionizing Vegetation Analysis with Sairone Solution
While indices provide a map of potential issues, platforms like Sairone deliver the diagnosis. Sairone leverages high-resolution drone imagery and specialized AI models to move from general metrics to specific solutions. Instead of just indicating low vigor, it enables targeted Weed detection and precise Plant health monitoring. This empowers farmers and environmental stewards to take immediate, informed action, turning complex visual data into a clear operational advantage.
Conclusion
From the foundational principles of NDVI to the intelligent diagnostics of modern AI platforms, the journey of Vegetation index analysis is one of increasing precision and actionability. The ultimate goal remains constant: to understand and manage our planet's green resources more effectively, ensuring a sustainable future through smarter technology.
Note: Some visuals on this blog post were generated using AI tools.
Comments
No comments yet!
Table of Contents
No headings were found on this page.