



Mapping Nitrogen Content in Crops
Map nitrogen content in crops using AI and drone technology to optimize yields, cut fertilizer waste, and boost sustainability in modern precision farming.
Written by Maryam
Reviewed by Boshra
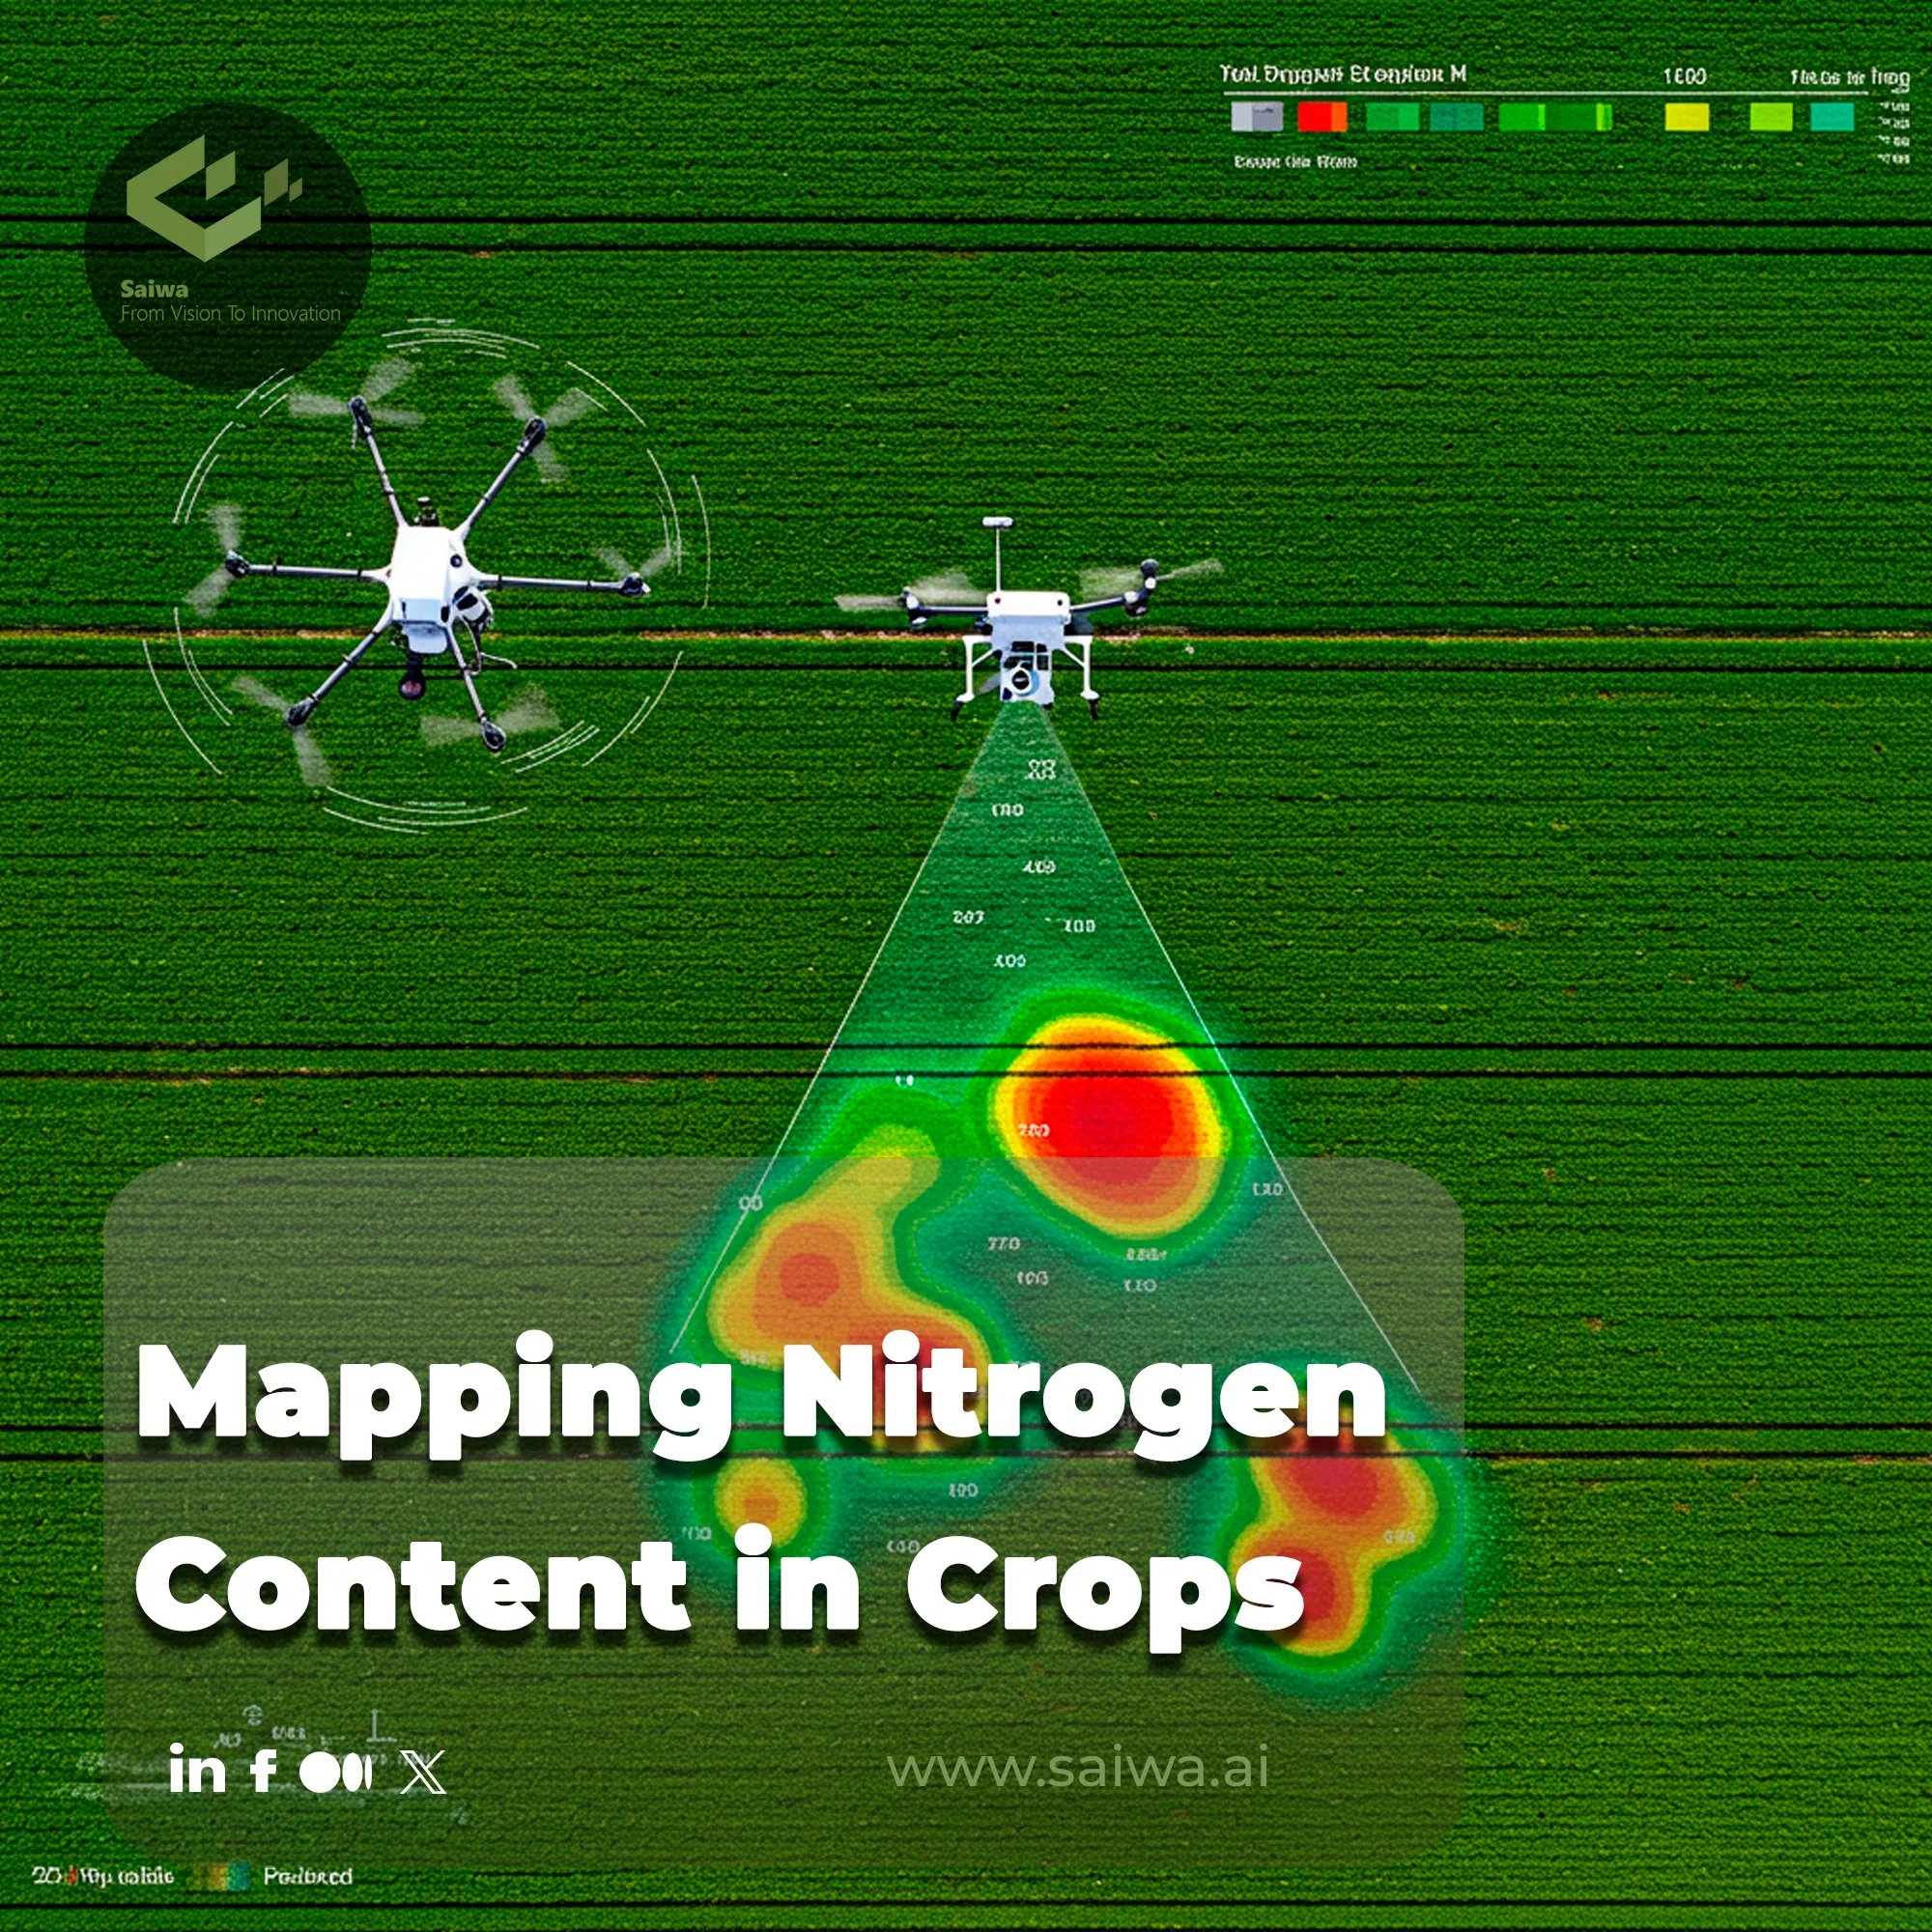
Nitrogen management represents one of modern agriculture's most critical balancing acts. As the elemental building block for amino acids and chlorophyll, its availability directly governs plant vitality and productivity. However, inefficient application leads to environmental degradation through nitrate leaching and greenhouse gas emissions.
Transitioning from reactive, often delayed, field sampling to predictive, data-driven oversight is therefore essential. Advanced platforms like Saiwa's Sairone are at the forefront of this shift, utilizing AI to interpret complex aerial data. This article explores the science and practical application of mapping nitrogen distribution.

Understanding Nitrogen’s Role in Plant Growth
Nitrogen is unequivocally the most demanded nutrient for plant life, constituting 5% of a plant’s dry matter. Nitrogen in plants is fundamental to the synthesis of proteins, which regulate all metabolic processes, and forms the core of the chlorophyll molecule, the engine of photosynthesis.
An insufficient supply manifests as chlorosis—a visible yellowing, typically beginning in older leaves—and stunted growth, directly compromising the plant’s ability to thrive and produce.
Read Also : VRA Prescription Maps | Soil and Nutrient Map Insights
Traditional Nitrogen Assessment Methods
For decades, growers have relied on methods that, while informative, were often slow and provided a limited snapshot of field conditions. Key techniques included:
Soil sampling and lab analysis: This involves collecting soil cores from various field locations and sending them to a laboratory. While accurate, the process can be slow, with results taking weeks to return, delaying critical fertilizer application decisions.
Tissue sampling and nutrient index: A more immediate method involves testing the nitrate-nitrogen content in plant tissue, often using a portable nitrate meter on petiole sap. Results are compared against a sufficiency index for the plant’s specific growth stage to determine if levels are deficient, adequate, or excessive.
The Modern Approach: Mapping Nitrogen via Drone and AI
The modern alternative bypasses physical sampling for advanced remote sensing. Drones equipped with multispectral sensors perform the task of Mapping Nitrogen Content in Crops by measuring the light reflected from plant canopies.
The core insight lies in analyzing the "red edge"—a specific region in the light spectrum where reflectance sharply increases. Nitrogen deficiency in plants alters the cellular structure and chlorophyll content of leaves, causing a measurable shift in this red edge. AI models are trained to translate these subtle spectral shifts into precise nitrogen level estimates.
What Makes a Nitrogen Map Agronomically Reliable?
A nitrogen map is only useful if it supports the right decision at the right growth stage. For professional growers, that means the map must reflect actual crop nitrogen status closely enough to guide sidedress timing, variable-rate application, or follow-up scouting without creating false confidence.
This is especially important because canopy reflectance responds not only to nitrogen, but also to biomass, crop stage, weather, and background variability across the field.[4][1]
Red-edge data is powerful, but context still matters
Red-edge bands are widely used because they are more sensitive to crop nitrogen status than standard visible-light measurements, especially once the canopy becomes denser. In a 2025 study using Sentinel-2 imagery and 1,627 destructive samples, multispectral red-edge indices were effective for estimating crop nitrogen content, and the delta red-edge index was the best predictor in that dataset.
However, the same study also found that spectral indices were poor predictors of nitrogen concentration alone, which is an important distinction for agronomic interpretation.
In practice, this means a map may be very good at showing where more total nitrogen is stored in the canopy, while still being less precise at diagnosing tissue concentration by itself. For field decisions, that is why growers should interpret nitrogen maps alongside crop stage, stand density, and recent growth conditions rather than treating color zones as a laboratory-equivalent test.
Why timing and growth stage matter
Nitrogen status should not be interpreted the same way all season. Canopy reflectance changes across development stages, and research on corn under different nitrogen treatments found that spectral behavior shifts over time as chlorophyll content, biomass, and environmental conditions change.
That is why the same reflectance pattern can mean different things in early vegetative growth versus a later, closed-canopy field. A map captured too early may overemphasize soil background effects, while a map captured too late may reflect biomass differences that are harder to correct economically.
A better decision framework
Question | Why it matters |
Was the map captured at the right crop stage? | Timing affects how strongly reflectance relates to nitrogen status and whether corrective action is still practical. |
Does the model use red-edge bands? | Red-edge-based indices generally perform better than standard red-based indices for nitrogen diagnostics. |
Is the map validated with field samples or scouting? | Ground truth reduces the risk of misreading biomass, stress, or sensor noise as a nitrogen problem. |
Are weather and management data included? | Model accuracy improves when spectral data is combined with agronomic context rather than used alone. |
From map to variable-rate action
The most effective workflow is not “fly once, fertilize everywhere the map looks yellow.” A stronger approach is to use the nitrogen map to rank zones, ground-check representative areas, and then convert confirmed variability into variable-rate prescriptions or targeted follow-up.
This matches the broader direction of precision nitrogen management, where remote sensing is most valuable when it helps reduce blanket application, improve input timing, and focus field attention where returns are most likely.
Sairone’s crop health workflow is built for that kind of operational use. Its platform supports plant health interpretation, localized alerts, and prescription-map export for precision sprayers, which makes nitrogen mapping more actionable when integrated into a broader in-season management system.
Practical takeaway
For advanced farm operations, the best nitrogen map is not the one with the most colors. It is the one that combines red-edge sensing, crop-stage awareness, and field validation well enough to support confident fertilizer decisions with less waste and lower agronomic risk.
Interpreting a Nitrogen Distribution Map
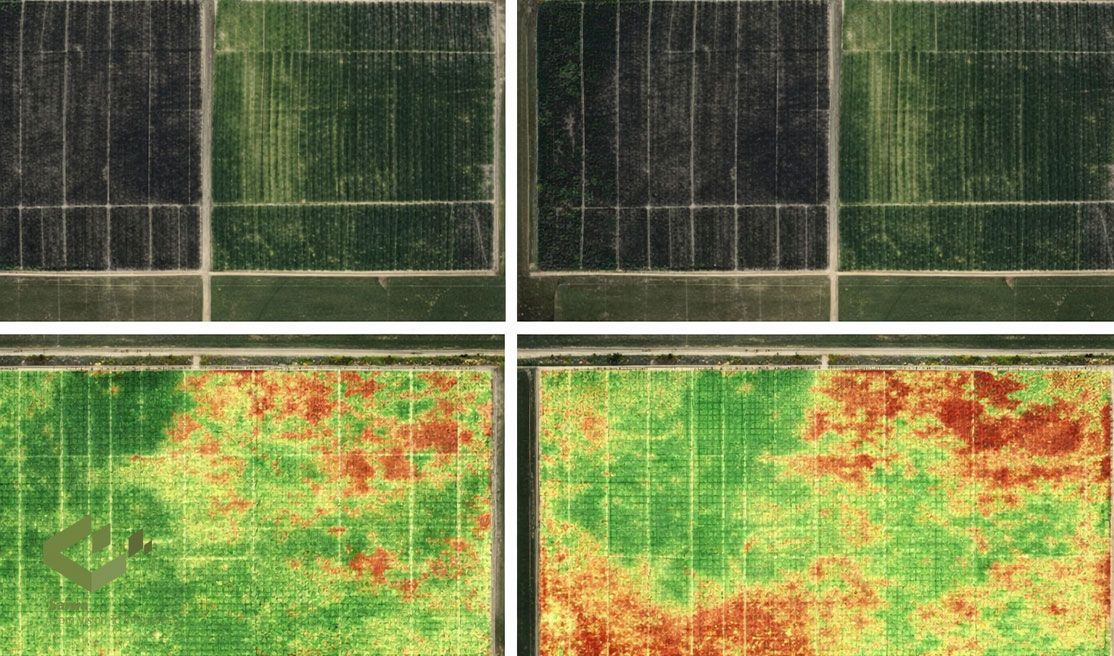
The final output is far more than a simple image; it is a powerful data visualization tool. A nitrogen distribution map uses a color-coded gradient (e.g., red for deficient, yellow for moderate, green for sufficient) to show nitrogen variability across an entire field. This enables growers to move beyond uniform fertilizer application and adopt a precision approach, targeting inputs only where needed and in the correct amounts.
Benefits of AI-Based Nitrogen Mapping for Farmers
Adopting this data-driven strategy through plant health monitoring unlocks significant operational and financial advantages that transform farm management. Notable benefits include:
Reduced fertilizer costs and environmental runoff: Applying nutrients only where they are needed eliminates waste.
Increased crop yield and plant health: Correcting nutrient deficiencies leads to healthier, more productive crops.
Field-wide insights for optimized management: The complete spatial view enables superior Crop yield estimation and decision-making.
Support for precision agriculture programs: The data provides a foundational layer for Variable Rate Application (VRA) systems.
How the Mapping Process Works
The process, powered by platforms like Saiwa’s Sairone, streamlines data collection and analysis into a clear workflow that delivers actionable intelligence from the sky to the soil. Here is a simplified breakdown of the core steps involved in Mapping Nitrogen Content in Crops:
Step 1: Drone data acquisition over the field: A drone flies a pre-programmed route, capturing high-resolution multispectral imagery.
Step 2: Image preprocessing and segmentation: The raw images are stitched together and corrected for atmospheric distortions.
Step 3: AI analysis of leaf nitrogen indicators: An AI algorithm analyzes the spectral signature of the vegetation, pixel by pixel.
Step 4: Generation of map with nitrogen distribution: The analysis is converted into a final, intuitive, color-coded map for farmer use.
AI-Powered Nitrogen Insights with Sairone
This is where science meets practical farming. Sairone, Saiwa’s advanced agricultural platform, uses AI to automatically analyze multispectral drone imagery and translate complex spectral data into actionable nitrogen distribution maps. Sairone goes beyond simple observation, enabling the precise identification of nutrient-deficient areas and supporting the application of fertilizer in targeted areas.
For farmers, this approach replaces guesswork with data-driven certainty. Integrating Sairone into your workflow transforms aerial data into clear, field-level recommendations, reducing input waste, improving crop health, and maximizing yield. This offers a practical path toward smarter, more sustainable nitrogen management.
Conclusion
Efficient nitrogen management is no longer a guessing game; it is a science-driven process that empowers farmers to act with precision and confidence. By combining drone-based imagery with AI-powered analysis, growers can visualize nutrient variability across entire fields in real time. This allows them to replace blanket fertilizer applications with targeted, data-informed decisions. This approach maximizes crop health and yield potential while reducing input waste and minimizing environmental impact. Embracing AI-driven nitrogen mapping enables farmers to transition from reactive to proactive management strategies, fostering a more productive and sustainable future for agriculture.
Note: Some visuals on this blog post were generated using AI tools.
About the team
Continue reading
Revolutionizing Agriculture | Enhanced Soil Monitoring Using AI Insights
Soil health is critical to functional and productive agricultural systems. Regular monitoring of soil parameters is crucial for high-quality
How Precision Spraying Technology Is Transforming Farming Efficiency
Modern agriculture operates under the immense pressure to boost productivity while simultaneously minimizing its ecological footprint. The e
Plant Disease Detection - A Key Strategy for Sustainable Crop Management
Ensuring global food security is directly threatened by the silent spread of crop diseases, which can decimate harvests before symptoms are
Challenges of Green-on-Green Detection in AI-Based Weed Recognition Systems
Why Green-on-Green Detection Is Intrinsically DifficultThe transition from green-on-brown to green-on-green weed detection represents one of
Revolutionizing Agriculture | A Comprehensive Guide to IoT-Based Irrigation Systems
The global demand for food is projected to increase significantly in the coming decades, placing immense pressure on existing agricultural p
Automated Farming - AI-Driven Agriculture Revolution
Global food demand is rising everyday and it is estimated to double by 2070, yet traditional farming faces mounting challenges from labor sh
Comments
Be the first to share your thoughts
No comments yet
Start the conversation by sharing your thoughts
Share this article
Help others discover this content
Table of Contents
No headings were found on this page.