



How to Create Weed Maps from UAV Imagery
Learn how to create UAV weed maps using deep learning, geospatial processing, validation, and targeted spraying workflows.
Written by Amirhossein
Reviewed by Boshra
Introduction
Weed mapping from unmanned aerial vehicle (UAV) imagery combines aerial data capture, image processing, plant classification, spatial analysis, and field execution. The objective is not simply to produce an attractive image of a field. A useful weed map must identify where weeds occur, represent their spatial distribution accurately, and convert those findings into information that supports scouting, treatment planning, or targeted spraying.
Research has demonstrated that deep-learning models can detect weeds across multiple agricultural fields and produce spatial maps that correspond closely with expert field surveys. In one large-scale study of winter wheat, UAV imagery was used to map black-grass across 31 fields covering 205 hectares. The resulting model achieved an accuracy above 0.9, while image-derived weed maps showed a statistically significant correlation greater than 0.75 with field observations. This article explains the technical workflow behind UAV-based weed mapping, from sensor selection and segmentation to map generation, accuracy assessment, targeted application, and the role of Sairone in AI-driven precision agriculture.
Foundations of Aerial Weed Detection
From Aerial Imagery to Weed Distribution Layers
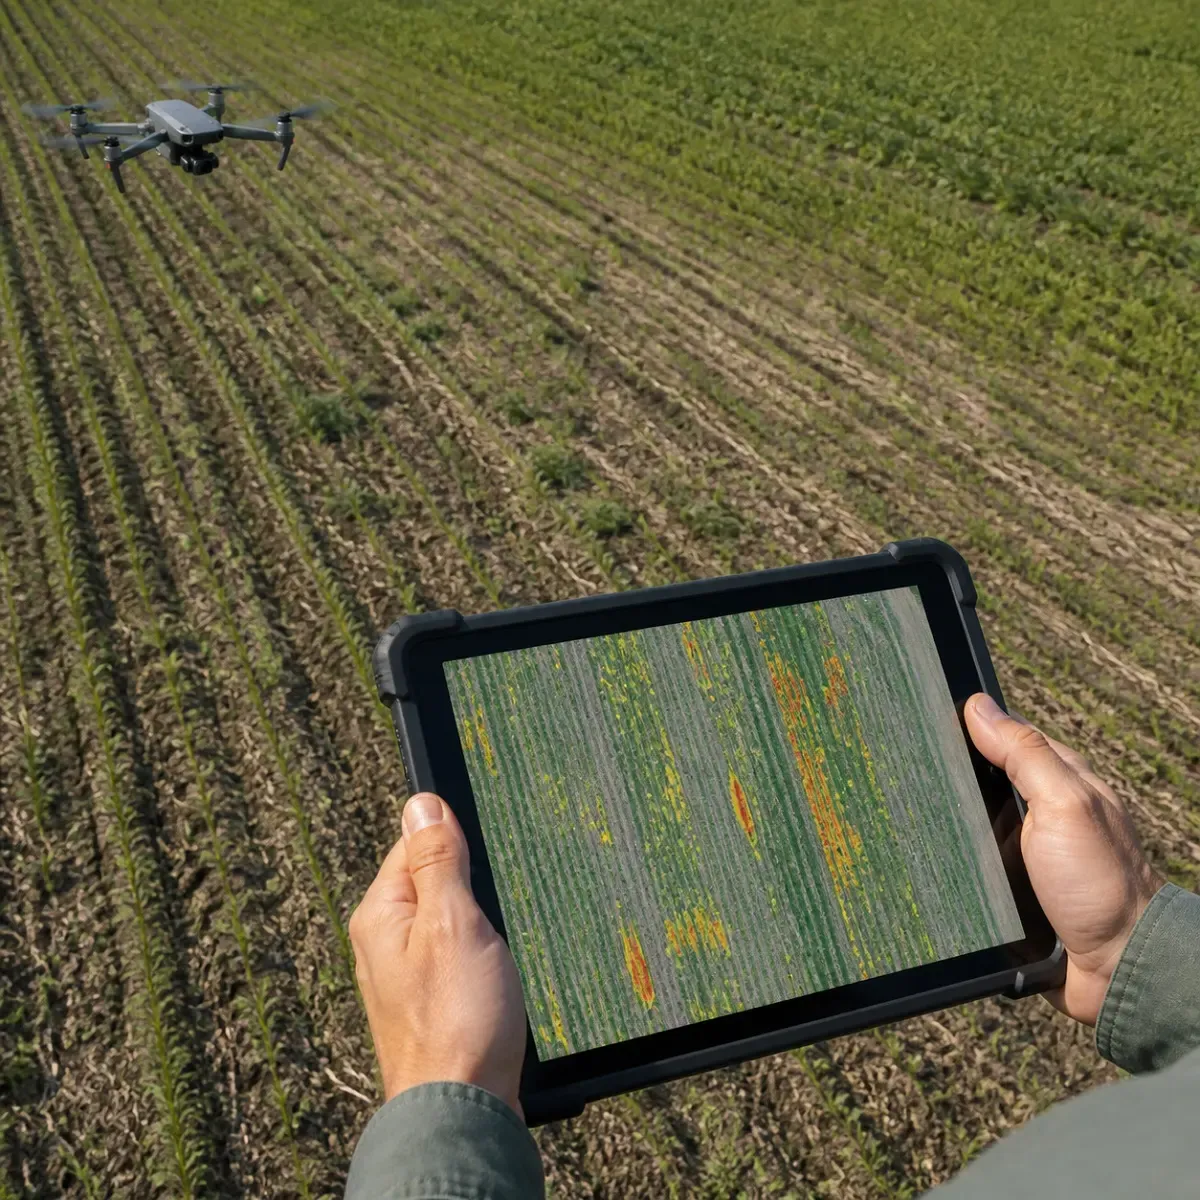
A UAV weed-mapping workflow begins with the collection of aerial imagery over a defined agricultural area. The aircraft captures images that can later be processed into spatially aligned information about crop and weed distribution. When multiple overlapping images are combined, the resulting dataset can support field-scale analysis rather than isolated visual inspection.
The central output is a spatial weed-distribution layer. This layer associates detected weeds with their locations in the field, allowing agronomists and growers to distinguish areas with substantial infestation from areas with little or no detectable weed presence. In the black-grass study, deep learning was applied to UAV imagery to produce both local and global weed maps. These maps were then compared with expert field surveys collected across 31 fields and 205 hectares.
This distinction between local and global mapping is operationally important. Local maps can show the detailed distribution of weeds within individual field sections, while global maps provide a broader view of infestation across a larger survey area. A map becomes more useful when it can be explored interactively, examined at field level, and connected to downstream agronomic decisions. The study described an interactive dashboard through which users could inspect model predictions for each field.
Navigating Sensor Options and Spectral Requirements
The information contained in aerial imagery depends on the remotely sensed signals available to the classification system. Remote sensing is used to infer functional vegetation traits from plant signals, creating information that can support several plant-based applications. For weed mapping, the practical requirement is to separate weeds from the crop and surrounding soil or residue with sufficient spatial and spectral information.
The choice of imagery should therefore reflect the target weed, crop growth stage, expected weed size, canopy structure, and intended output. High-resolution imagery can support the detection of smaller plants, whereas lower-resolution imagery may be more appropriate for identifying larger weed patches or directing scouting. The Iowa State University review notes that some mapping tools are designed around large weeds and major infestation zones, while other systems use high-resolution drone imagery to detect weeds approximately one-quarter inch tall or larger.
Imagery quality also affects whether the system can distinguish green weeds within a green crop canopy. Green-on-brown mapping is generally less demanding because vegetation contrasts with exposed soil or residue. Green-on-green detection is more difficult, particularly when weeds are below the crop canopy or visually similar to the crop. The selected sensor and flight design must provide data that preserves the plant-level distinctions required by the classification model.

Deep Learning Architectures for Plant Classification
Role of Neural Networks in Image Segmentation
Deep learning models can analyze UAV imagery at scale and identify weed presence across large agricultural areas. Their value lies in converting complex visual patterns into spatial predictions that can be examined as maps. Rather than relying only on manual interpretation, the model processes imagery and assigns predictions to locations within the field.
For weed detection, the model may operate at the level of individual image regions or pixels, depending on the architecture and workflow. The resulting prediction can represent the presence, absence, or spatial extent of the target weed. In the black-grass research, a deep-learning approach was used to detect the weed in winter wheat and generate field-level distribution maps.
The strength of this approach depends on the relationship between the training data and the conditions under which the system will be deployed. A model must encounter enough variation in field conditions, crop appearance, lighting, weed density, and background characteristics to produce reliable predictions beyond a single test location. The large-scale validation across 31 fields was significant because it evaluated the approach across multiple fields rather than relying on a narrowly controlled demonstration.
Evaluating Detection Metrics and Model Performance
A weed map should be evaluated against an independent reference, such as an expert field survey. Visual quality alone cannot establish whether the predicted distribution is reliable. Comparison with field observations makes it possible to quantify both classification performance and the relationship between predicted weed patterns and observed infestation.
The black-grass study reported accuracy above 0.9. It also found a correlation greater than 0.75 between imagery-derived local and global weed maps and out-of-bag field survey data, with statistical significance reported at (p < 0.00001). These values describe the performance achieved in that specific study context and should not be treated as universal guarantees for every crop, sensor, weed species, or flight configuration.
Operational evaluation should also consider how the map will be used. A model that performs well statistically may still require review before a herbicide prescription is executed. Human validation, field scouting, and examination of confidence scores can help identify uncertain detections and prevent a classification output from being treated as an unquestionable field instruction.
Operationalizing Weed Mapping for Precision Agriculture
Processing Workflows for High-Density Data
The operational workflow usually includes image capture, data transfer, processing, classification, spatial visualization, and export. UAV imagery may be processed into a georeferenced mosaic or another spatially organized dataset before the weed-detection model is applied. The model then produces detections that can be visualized according to field boundaries or management regions.
The output should remain connected to geographic coordinates. This allows the user to move from a visual detection to a real field location and to compare the result with scouting observations or application equipment. Sairone’s documented workflow supports images, videos, orthomosaics, orthophotos, GeoTIFF files with embedded spatial coordinates, and batch uploads for large field surveys. Its cloud environment stores uploaded imagery, inputs, and processed outputs in an organized file structure.
Large datasets create practical processing demands. Cloud-based processing allows users to upload imagery, run computer-vision models, and generate reports without building and maintaining their own infrastructure. For GeoTIFF data, Sairone can extract geospatial metadata, preserve the coordinate reference system, and associate detections with precise locations for GIS workflows.
The result should be inspected before it is used for treatment. Sairone documents a human-in-the-loop process in which users can verify, correct, and approve AI-generated detections. Approved results can then be transferred to Atlas for distribution visualization, infestation analysis, treatment-map generation, and geospatial decision support.
Translating Maps into Targeted Spray Prescriptions
A weed map becomes an actionable agronomic product when it can inform where and how treatment should occur. UAV-based mapping supports a multistep approach: the drone surveys the field, the imagery is processed into weed information, and a prescription is generated before the application event. That prescription can then be imported into a spray drone or a ground sprayer equipped with nozzle-control capabilities.
Preplanned prescriptions offer several operational advantages. The operator can adjust tank mixes and application volumes according to the detected weed pressure. The sprayer can operate at its normal speed, and dust does not interfere with a prescription that was generated before the application pass. This workflow differs from real-time boom-mounted sensing, which detects plants during the spraying operation.
The Iowa State University demonstration used drone-based mapping to create a customized herbicide prescription within 24 hours of deployment. The prescription was loaded into a John Deere ExactApply machine, although the article also notes that similar prescriptions can be uploaded to other sprayers with nozzle control. The system applied 70 gallons of tank mix to a soybean area, compared with 130.5 gallons that would have been applied through a 15-gallon-per-acre broadcast treatment over the same area. The reported result was nearly 50% product savings and a chemical-cost saving of \$13.42 per acre.
These results depend on the weed pressure detected in the field, and reductions are not guaranteed in every application. The economic value of targeted spraying is therefore linked to the spatial distribution and intensity of the infestation, as well as the compatibility between the exported prescription and the application platform.
Factors Influencing Detection Accuracy
Challenges of Dense Canopies and Crop Overlap
The crop canopy is one of the main visual challenges in weed detection. When weeds emerge below or within a dense crop canopy, their visible features may be partially hidden. Similar green coloration between crop and weed can further reduce the distinction available to the classification model.
The Iowa State material distinguishes between green-on-brown and green-on-green use cases. Grid-based tools are primarily used for green-on-brown conditions, although they have also been used for green-on-green detection when large weeds extend above the crop canopy. The same material notes that some mosaics do not provide enough resolution to detect the smallest weeds.
Detection accuracy is also affected by the intended weed category. A system designed to identify large patches may not be suitable for early detection of small individual plants. Conversely, a high-resolution workflow may generate more detailed information but require greater data-management and processing capacity. Map users should therefore interpret a detection result in relation to the imagery resolution, crop stage, target species, and survey objective.
Optimizing Flight Parameters for Data Quality
Flight planning determines the quality and consistency of the imagery supplied to the model. Altitude affects ground sampling detail, while flight coverage and image overlap influence the quality of the assembled aerial dataset. Drone imagery can be collected at different altitudes and resolutions, and Sairone’s documented input support includes high-resolution captures and precision orthophotos.
The appropriate configuration depends on whether the objective is broad weed-pressure assessment, identification of larger infestation patches, or detection of small plants. High-resolution imagery is particularly relevant when the application requires plant-level discrimination. The Iowa State material reports that one high-resolution drone system was designed to detect weeds approximately one-quarter inch tall and larger.
A robust workflow should also include quality control after capture. The user should confirm that the field is adequately covered, the imagery is spatially usable, and the output remains aligned with the coordinate system required by the intended GIS or spraying workflow. In Sairone, geospatial metadata extraction and coordinate-reference-system preservation are documented components of GeoTIFF handling.
Economic and Environmental Impact of Precision Spraying
Quantifying Herbicide Savings and Input Optimization
The primary economic argument for targeted spraying is the potential to reduce chemical use in areas where weeds are absent. The amount saved depends on initial weed pressure and the accuracy of the map or prescription. The Iowa State article states that reductions of 50% or higher are not uncommon in precision post-emergence applications, while also emphasizing that savings are directly related to detected weed pressure and are not guaranteed.
In the reported soybean demonstration, targeted application resulted in nearly 50% product savings and \$13.42 per acre in chemical savings without a significant difference in grain yield compared with the control broadcast treatment. This finding illustrates how a spatially variable prescription can reduce input volume while maintaining the measured agronomic outcome in that demonstration.
Precision spraying can also improve the composition and volume of the tank mix. When infestation patterns are known before application, operators can optimize treatment planning rather than applying the same rate uniformly across the entire field. This approach supports more deliberate use of herbicides and creates a direct connection between the weed map and the field operation.
Comparative Analysis of Ground and Aerial Solutions
Ground-based and aerial approaches address different parts of the precision-spraying problem. Ground systems may use cameras mounted on the spray boom to detect weeds in real time. These systems can support highly localized application during the pass, with ground sprayers capable of treating areas as small as approximately 0.001 acre when equipped with nozzle control.
Drone-based mapping follows a separate sequence. The UAV surveys the field first, the imagery is processed, and the resulting prescription is executed later. Spray drones generally perform zone spraying rather than spot spraying, with minimum zone sizes of approximately 0.1 acre according to the Iowa State article.
The preplanned aerial workflow can reduce the effect of dust, allow normal operating speed, and avoid some up-front costs associated with real-time boom-mounted systems. Its limitation is that the quality of the application depends on the accuracy, resolution, timeliness, and compatibility of the preceding mapping workflow. The best technical choice depends on field size, weed distribution, equipment, crop conditions, and the level of spatial precision required.
Sairone and its Field Application in AI-Driven Precision Agriculture
Scaling Remote Sensing Data through Cloud Intelligence
Sairone is Saiwa’s AI-driven platform for agriculture and environmental monitoring. It is positioned as a B2B SaaS platform for agri-service providers, agronomists, cooperatives, and ecologists, with services that include weed and invasive-plant control, crop-health monitoring, crop counting, yield estimation, and other plant-analysis applications.
The platform accepts several forms of geospatial imagery, including drone images, videos, orthomosaics, orthophotos, GeoTIFF files, precision orthophotos, and georeferenced datasets. It also supports multiple image formats and batch uploads for large field surveys. Uploaded imagery and processing outputs are stored in a cloud-based Files section, where users can organize datasets and results.
The documented system supports large-file and large-dataset uploads, but the available product materials do not identify a service or capability specifically named “Mega files.” They do explicitly document support for large files, batch uploads, TIFF and GeoTIFF formats, and orthomosaic inputs. Accordingly, high-density TIFF or GeoTIFF orthomosaic workflows can be described as supported through the documented file and geospatial capabilities, without assigning an undocumented file-size limit or claiming that local data reduction is never required.
Sairone’s cloud workflow is designed to let users upload data, process it, and generate reports without developing or maintaining their own infrastructure. Its documented processing capabilities include scalable infrastructure, computer vision, real-time processing, incremental learning, and integration with geospatial coordinates.
Automated Species Identification and Density Mapping
Sairone’s Weed and Invasive Plant Control service applies computer vision and machine learning to detect weeds and invasive plants, map their locations, analyze infestations, and produce treatment-oriented data. The service documentation reports model accuracy exceeding 99% and describes incremental learning intended to reduce false positives over time.
The system provides detection confidence scores, geospatial coordinates, and mapped weed locations. Supported examples include Taraxacum or dandelion, Amaranthus tuberculatus or waterhemp, Amaranthus palmeri or Palmer amaranth, European water chestnut, water soldier, Fleabane, and Thistle.
The output is designed for spatial analysis rather than simple species labeling. Users can review detections through a human-in-the-loop validation process, correct or approve AI-generated results, and move validated detections into Atlas. Atlas supports distribution visualization, infestation-pattern analysis, treatment-map generation, and geospatial analytics for precision-agriculture decisions.
The platform documentation describes weed-distribution maps, infestation analysis, clustering maps, and treatment zones. It does not use “density map” as the formal name of a documented feature. In technical terms, however, these spatial outputs can represent the distribution and concentration of detections across a field, provided the user interprets them according to the underlying detection and mapping workflow.
Translating Spatial Insights into Variable-Rate Field Action
Sairone provides GIS-ready outputs in GeoJSON, Shapefile, KML, and CSV formats. These formats allow detection and treatment information to move into external GIS and farm-management workflows. The documented outputs include interactive weed-distribution maps, clustering maps, and treatment zones for precision spraying.
Atlas includes intelligent detection-clustering algorithms that group detected weeds into manageable treatment zones. It also supports custom region definition, hierarchical field-zone management, and real-time geospatial analytics dashboards. These capabilities help transform individual detections into spatial units that can be reviewed and managed operationally.
The available documentation supports treatment-zone generation and precision-spraying workflows, but it does not explicitly name smart-sprayer hardware integration or guarantee that clustering is completed within a specified number of hours. The platform can therefore be accurately described as producing GIS-ready treatment information that may support compatible precision-spraying operations, with final equipment integration depending on the client’s workflow and system requirements.
Custom AI Infrastructure and Enterprise B2B Customization
Sairone is designed around a flexible delivery model rather than a single fixed deployment pattern. Saiwa offers the Sairone cloud platform, API integration with a client’s existing infrastructure, and fully customized white-label platforms developed around the customer’s brand, needs, and workflow.
The company also provides customized AI development and specialized models for particular agricultural and environmental challenges. This verticalized approach allows the detection model and reporting environment to be aligned with the target audience, data type, and operational context. The platform’s documented use cases extend across agriculture, wildlife, greenhouses, and environmental monitoring.
Its multi-tenant architecture supports Back-end as a Service and white-labeling, while the main dashboard includes processing statuses, storage utilization, service-usage statistics, recent uploads, processing-time analytics, annotation progress, Atlas regions, charts, and visualizations. The annotation system supports polygons, bounding boxes, GeoTIFF annotation, multiclass labeling, custom class colors, and precision drawing.
For enterprise users, this combination provides several integration paths: use the hosted platform, connect through customized APIs, or deploy a branded environment tailored to business requirements. The available materials establish the presence of BaaS, API integration, white-label delivery, dashboards, and customized models, but do not specify endpoint structures, authentication methods, payload schemas, or a guaranteed processing-time target.
Conclusion
Creating a weed map from UAV imagery requires more than collecting aerial photographs. The workflow must connect suitable imagery, deep-learning classification, geospatial referencing, independent validation, and an exportable treatment layer. Research on black-grass detection demonstrates that UAV-based deep learning can achieve strong performance at field scale when evaluated against expert surveys. Field demonstrations further show how preplanned prescriptions can reduce herbicide use while preserving the measured agronomic outcome in a specific soybean application.
For production use, the map must remain operationally connected to the field. Sairone extends this workflow through cloud-based image processing, species-oriented weed detection, human validation, Atlas-based spatial analysis, clustering, treatment-zone generation, and GIS-ready exports. The practical value lies in the complete chain from image acquisition to defensible spatial decisions and compatible field execution.
Comments
No comments yet!
Table of Contents
No headings were found on this page.