



How AI Identifies Invasive Plants: Visual and Spectral Features
Learn how AI combines visual features, spectral bands, and deep learning to identify and map invasive plants
Written by Amirhossein
Reviewed by Boshra
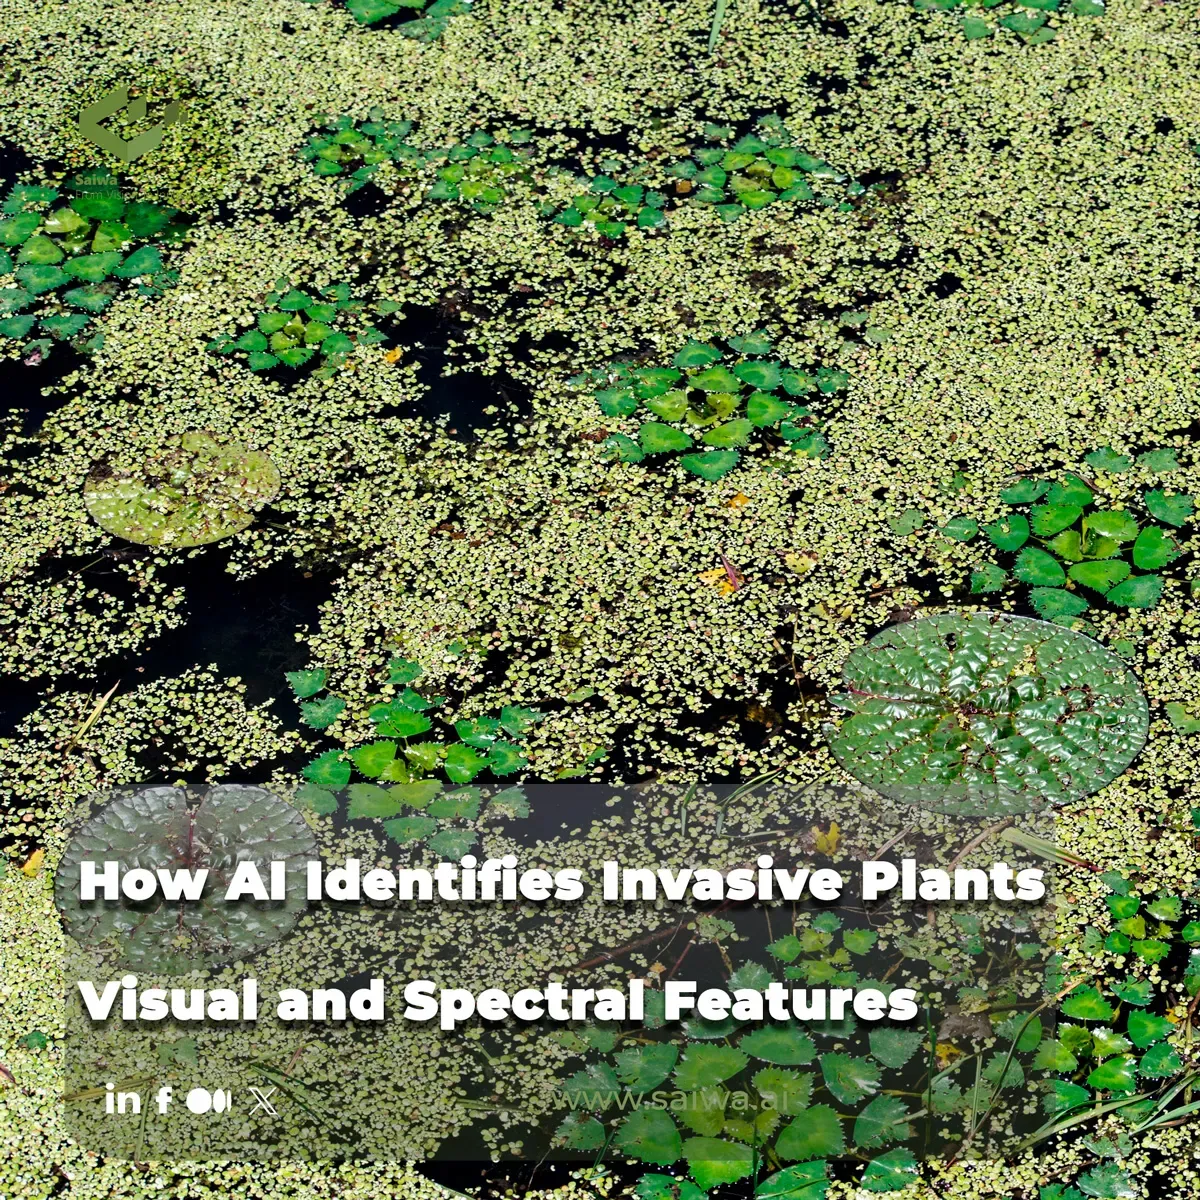
Remote sensing has become an important method for detecting invasive plants across landscapes that are difficult to survey consistently from the ground. Satellite, airborne, and drone imagery can provide spatially explicit information about plant distribution, while machine-learning models can use image patterns, spectral responses, and temporal observations to distinguish target species from surrounding vegetation.
This article explains how AI-based invasive-plant detection works at the feature level. It examines visual cues such as canopy structure and texture, spectral information from green, red-edge, and near-infrared bands, the role of multi-sensor data fusion, and the methods used to evaluate classification performance. It then connects these capabilities to Sairone, Saiwa’s cloud-based platform for AI-assisted weed detection, geospatial analysis, and precision treatment planning.
Visual Feature Extraction in Aerial Imagery
Analyzing Leaf Morphology and Canopy Texture
Visual analysis begins with the spatial structure recorded in an image. A plant population is not represented only by its color. Its appearance also includes the arrangement of leaves, the shape and density of the canopy, the distribution of gaps, and the texture created by neighboring plants. These characteristics can help separate a target species from other vegetation when the image provides sufficient spatial detail.
The importance of spatial resolution is illustrated by research on leafy spurge, an invasive plant detected across a heterogeneous landscape in Minnesota. The study compared WorldView-2 and PlanetScope satellite imagery. WorldView-2 offered higher spatial and spectral resolution, whereas PlanetScope provided daily image acquisition with comparatively lower spatial and spectral resolution. This distinction reflects a central challenge in invasive-plant monitoring: detailed imagery can preserve more visual information, while frequent imagery can provide stronger temporal coverage.
Spatial information is especially valuable in landscapes where invasive plants occur alongside crops, native vegetation, bare soil, roads, or other land-cover types. A model must identify patterns associated with the plant itself while separating them from patterns generated by the surrounding environment. When the target occurs in small or fragmented populations, the available spatial resolution can influence whether the model captures individual plants, groups of plants, or broader patches.

Utilizing Convolutional Networks for Shape Recognition
Convolutional neural networks are well suited to image-based classification because they learn spatial patterns from image inputs. Rather than relying only on manually selected rules, a CNN can learn combinations of local and broader image features associated with a target species. These learned representations may include edges, forms, textures, and spatial arrangements that become useful for classification.
Lake, Runquist, and Moeller developed CNN models to detect leafy spurge using WorldView-2 and PlanetScope imagery. The WorldView-2 model achieved 96.1% detection accuracy, while the model based on PlanetScope imagery achieved 89.9% accuracy. These results show that deep-learning classification can operate with different levels of spatial and spectral detail, but performance may change according to the information available in the input imagery.
The researchers also modified the PlanetScope CNN by adding a long short-term memory layer. This allowed the model to use phenological information from an image time series rather than treating each image as an isolated observation. The resulting PlanetScope LSTM model reached 96.3% accuracy, comparable to the WorldView-2 model. The result demonstrates that temporal context can compensate, at least in this application, for some limitations in spatial and spectral resolution.
Spectral Signature Analysis and Band Optimization
Capturing Near-Infrared and Red-Edge Reflectance
Spectral features describe how vegetation reflects electromagnetic energy across different wavelength regions. Two plants may appear similar in a conventional image while producing different responses in selected spectral bands. Multispectral and hyperspectral sensors provide opportunities to examine these differences more systematically.
The leafy-spurge study found that green, red-edge, and near-infrared bands were important for differentiating the invasive plant from other vegetation. These bands can contribute information that is not fully represented by visible appearance alone. Green reflectance can help characterize vegetation appearance, while red-edge and near-infrared responses provide additional spectral separation between plant classes.
NASA’s remote-sensing training materials identify multispectral and hyperspectral datasets as important data sources for invasive-species mapping and monitoring. The material also distinguishes the properties of multispectral and hyperspectral data and highlights hyperspectral remote sensing for invasive-grass mapping. The broader implication is that sensor selection should correspond to the discrimination problem: the number and placement of bands influence the information available to the classification model.
Hyperspectral imagery provides a more detailed spectral description than conventional multispectral imagery. This can be useful when invasive species have subtle spectral differences from co-occurring plants. However, the value of additional spectral information depends on image quality, acquisition conditions, reference data, and the ability of the classification workflow to use those measurements reliably.
Processing Vegetation Indices for Threat Identification
Vegetation indices are commonly used as compact representations of spectral relationships. In an AI workflow, such derived variables can be considered alongside the original spectral bands, spatial features, and temporal observations when the processing design supports them. Their purpose is to make vegetation-related contrasts easier to analyze, particularly when the target plant differs from neighboring vegetation in its spectral response.
The supplied research directly demonstrates the importance of spectral-band selection rather than identifying a single universal index for all invasive plants. In the leafy-spurge application, green, red-edge, and near-infrared bands contributed to species differentiation. The hyperspectral mapping study likewise used detailed spectral data to classify Calamagrostis epigejos, Rubus spp., and Solidago spp..
The hyperspectral study applied a support vector machine classifier to three datasets collected in June, August, and September. Its classification maps achieved F1-scores ranging from 0.87 to 0.89 for Calamagrostis epigejos, 0.89 to 0.97 for Rubus spp., and 0.99 for Solidago spp.. These results indicate that spectral information can support species-level mapping, but performance should be assessed separately for each target class and acquisition period.
Multi-Sensor Data Fusion for Plant Discrimination
Combining Spatial Textures with Spectral Profiles
A robust invasive-plant detector often benefits from combining complementary sources of information. Spatial features describe what the plant or patch looks like in an image. Spectral features describe how it responds across wavelength bands. Temporal features describe how its appearance changes through the growing season.
The comparison between WorldView-2 and PlanetScope illustrates this combination of information. WorldView-2 supplied high spatial and spectral resolution, whereas PlanetScope supplied frequent daily observations. When the PlanetScope model incorporated an LSTM layer, it reached 96.3% accuracy, exceeding the accuracy of the original PlanetScope CNN and matching the WorldView-2 result. The model therefore benefited from the phenological sequence contained in the time series.
Hyperspectral approaches provide another form of data richness. The study of invasive plants in Poland used three HySpex hyperspectral datasets acquired in June, August, and September. Instead of relying on one date, the workflow evaluated classification across multiple seasonal observations. This design recognizes that plant appearance and detectability can vary during the growing season.
For operational monitoring, the most useful input may therefore depend on the landscape and management objective. High-resolution imagery may help resolve small patches and visual structure. Frequent imagery may reveal seasonal behavior. Hyperspectral data may improve spectral discrimination where multispectral information is insufficient. These sources can be used independently or combined according to the classification task.
Overcoming Environmental Obstacles and Illumination Shifts
Invasive-plant detection takes place under changing environmental conditions. Differences in illumination, vegetation development, background land cover, and image acquisition timing can alter the appearance of the same species. A model trained on one set of conditions may therefore encounter more uncertainty when applied to another landscape or season.
Temporal modeling provides one way to address this variability. In the leafy-spurge study, early- and mid-season phenological periods in the PlanetScope time series were particularly important for prediction. The result indicates that acquisition timing is not merely a scheduling detail. It can directly affect the separability of the invasive species from other vegetation.
The study also reported that most false-positive errors occurred near true leafy-spurge populations. This pattern is relevant to management because errors concentrated near actual populations may be less consequential than isolated detections far from any confirmed infestation. Nevertheless, such errors must still be measured and interpreted when maps are used to guide field activities.
NASA’s training framework emphasizes that remote-sensing datasets have both benefits and limitations for invasive-species monitoring. Effective deployment therefore requires attention to spatial, temporal, and spectral resolution, as well as the characteristics of the target habitat and the timing of image collection.
Evaluating Model Performance and Classification Accuracy
Assessing Precision Metrics in Complex Landscapes
Accuracy assessment is part of the detection workflow, not a final reporting formality. A model may perform well overall while producing weaker results for a particular invasive species, season, or landscape condition. Class-specific metrics are therefore important when the intended output is a species distribution map.
The leafy-spurge models produced different results depending on the sensor and architecture: 96.1% accuracy for WorldView-2, 89.9% for the original PlanetScope model, and 96.3% for the PlanetScope model incorporating an LSTM layer. These values show how model architecture and temporal information can influence performance.
The hyperspectral study used iterative accuracy-assessment techniques based on repeated sampling and multiple trained models. It calculated how frequently individual pixels were assigned to a particular class across the resulting post-classification images, creating a way to connect model assessment with map production. This approach addresses a practical problem: evaluating many models is separate from deciding which classification result should be used to create the final map.
The same study reported F1-scores by species rather than presenting one undifferentiated performance value. Solidago spp. achieved an F1-score of 0.99, while the ranges for Calamagrostis epigejos and Rubus spp. were lower and varied across the datasets. Such differences help users understand where a mapping product is strong and where additional validation may be necessary.
Mitigating Background Noise and False Positives
Background noise can arise when soil, crop rows, native plants, shadows, roads, or other land-cover elements resemble the target species. Models must distinguish meaningful plant signals from these surrounding patterns. Spatial context, spectral bands, and temporal observations can each contribute to reducing ambiguity.
False positives should also be evaluated spatially. In the leafy-spurge experiment, most false positives were located near true populations. This suggests that some apparent errors reflected the difficulty of drawing an exact boundary around an infestation rather than completely unrelated detections. For management, the practical significance of an error depends partly on its location and its effect on treatment decisions.
Classification confidence and geospatial precision are also important for operational use. A detection map becomes more useful when it identifies where a target occurs, communicates confidence, and can be transferred into a geospatial workflow. This is the point at which image classification becomes field intelligence rather than an isolated model output.

Sairone and its Field Application in AI-Driven Precision Agriculture
Scaling Remote Sensing Data Through Cloud Intelligence
Sairone is an AI-driven platform developed by Saiwa for processing and analyzing visual and geospatial data. The platform accepts images, videos, and orthomosaics, including orthomosaics generated from video. Its cloud architecture allows users to upload data, process it, and create reports without developing or maintaining their own processing infrastructure.
For weed-control workflows, Sairone supports drone imagery, orthophotos, GeoTIFF files with embedded spatial coordinates, and batch uploads. Supported image formats include TIFF, JPEG, and PNG. GeoTIFF processing includes automatic extraction of geospatial metadata and preservation of the coordinate reference system, helping maintain the spatial relationship between detections and the field environment.
Uploaded imagery, inputs, and outputs can be organized through cloud storage and folders. The platform is described as using scalable cloud infrastructure for AI processing, with real-time processing capabilities and integration with geospatial coordinate systems. This architecture is suited to workflows in which aerial imagery must move from upload and analysis to map generation and reporting.
Automated Species Identification and Density Mapping
Sairone’s “Weed and Invasive Plant Control” service uses computer vision to identify supported weed and invasive-plant species in imagery. The documented species include Taraxacum or dandelion, Amaranthus tuberculatus or waterhemp, Amaranthus palmeri or Palmer amaranth, European water chestnut, water soldier, Fleabane, and Thistle.
The workflow produces detection results with confidence scores and precise geospatial coordinates. Validated detections can be transferred to Atlas, where users can visualize weed distributions, analyze infestation patterns, generate treatment maps, and access geospatial analytics. Atlas also provides interactive maps, satellite and aerial imagery overlays, custom region definition, hierarchical field zones, and real-time geospatial dashboards.
The platform documents weed-distribution and clustering maps that help users interpret infestation patterns across a field. These spatial outputs support management decisions by showing where detections are concentrated and where treatment zones can be defined. The result is a transition from image-level recognition to geographically organized field information.
Translating Spatial Insights into Variable-Rate Field Action
Sairone and Atlas provide GIS-ready outputs in GeoJSON, Shapefile, KML, and CSV formats. These formats allow detection and treatment information to move into established geospatial and agricultural workflows. The documented workflow supports treatment-zone generation for precision spraying and targeted treatment strategies.
Atlas includes intelligent detection-clustering algorithms that group identified weeds into manageable treatment zones. Instead of requiring agronomists to interpret every individual detection as a separate operational unit, clustering can organize affected sections into more practical management blocks. This supports planning for precision treatment and optimized spraying operations.
The resulting maps can be used alongside field boundaries, aerial imagery, satellite layers, and user-defined zones. In this form, AI outputs become actionable spatial layers: they identify the target, preserve its location, and organize the detections into treatment-oriented areas that can be reviewed by agricultural teams before field deployment.
Custom AI Infrastructure and Enterprise B2B Customization
Sairone is designed to support customized AI development for agricultural and environmental challenges. Saiwa develops specialized models for particular use cases rather than limiting customers to a single fixed application. Models can be adapted to the audience’s requirements and the type of data being analyzed.
The annotation workflow supports customizable class definitions and color assignments, along with multiclass annotation, polygons, and bounding boxes. These capabilities help structure training and labeling processes around the plant categories and operational objects relevant to a customer’s project.
For enterprise integration, Sairone supports Back-end as a Service and white-labeling through a multi-tenant structure intended for agritech companies that outsource product development. Customized APIs can be integrated into existing client infrastructure, and Saiwa can develop a white-label platform around a customer’s brand, requirements, and workflow. This makes the system applicable not only as a standalone analysis environment, but also as an AI capability embedded within a broader agricultural technology product.
Conclusion
AI identifies invasive plants by combining several forms of evidence. Visual features describe morphology, canopy structure, and texture. Spectral bands, particularly green, red-edge, and near-infrared information, improve discrimination between target and non-target vegetation. Temporal imagery adds phenological context, while hyperspectral data can provide detailed measurements for species-level classification.
Model performance depends on the sensor, acquisition timing, architecture, landscape complexity, and validation method. The reported results show that deep-learning and hyperspectral workflows can achieve strong classification performance, but accuracy remains species- and dataset-dependent. Sairone extends this analytical process into a cloud-based operational workflow by supporting drone imagery, georeferenced files, computer-vision detection, spatial clustering, GIS-ready exports, treatment-zone generation, and customized enterprise integrations.
References (1)
About the team
Continue reading
Which Perennial Weed Patches Should You Treat First After Harvest?
A scattered patch of perennial weeds after harvest can be easy to postpone. That is often the point at which it becomes a more persistent ma
Pre-Seed Weed Mapping for More Cost-Efficient Winter Wheat Establishment
Winter wheat establishment begins before the drill enters the field. Weed pressure already present in the seedbed can compete for moisture,

When Delaying Post-Harvest Weed Control Costs More Next Season
A post-harvest weed flush can look less urgent than a problem in a standing cash crop. That impression is often expensive. Escaped weeds con
Volunteer Canola After Harvest: When Is Spraying Worth the Cost?
Volunteer canola is a post-harvest management issue with both immediate and multi-season consequences. Seed lost during combining can germin
A Practical Framework for Using Fall Weed Maps to Make Better Spray Decisions
A fall weed map is useful only when it changes what happens next. It may show where weeds survived, where patches are recurring, or where a
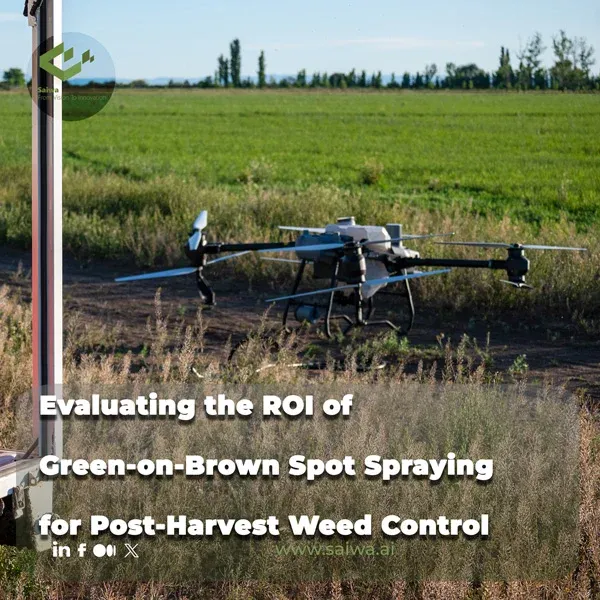
Evaluating the ROI of Green-on-Brown Spot Spraying for Post-Harvest Weed Control
Post-harvest fields often show an uneven weed pattern: a few dense patches, thin linear infestations, and large areas with little green vege
Comments
Be the first to share your thoughts
No comments yet
Start the conversation by sharing your thoughts
Share this article
Help others discover this content
Table of Contents
No headings were found on this page.