



Crop Yield Estimation with NDVI: What Farmers Should Know
Discover how NDVI helps farmers estimate crop yields, track plant health, and make data-driven decisions for better productivity and sustainability.
Written by Maryam
Reviewed by Boshra
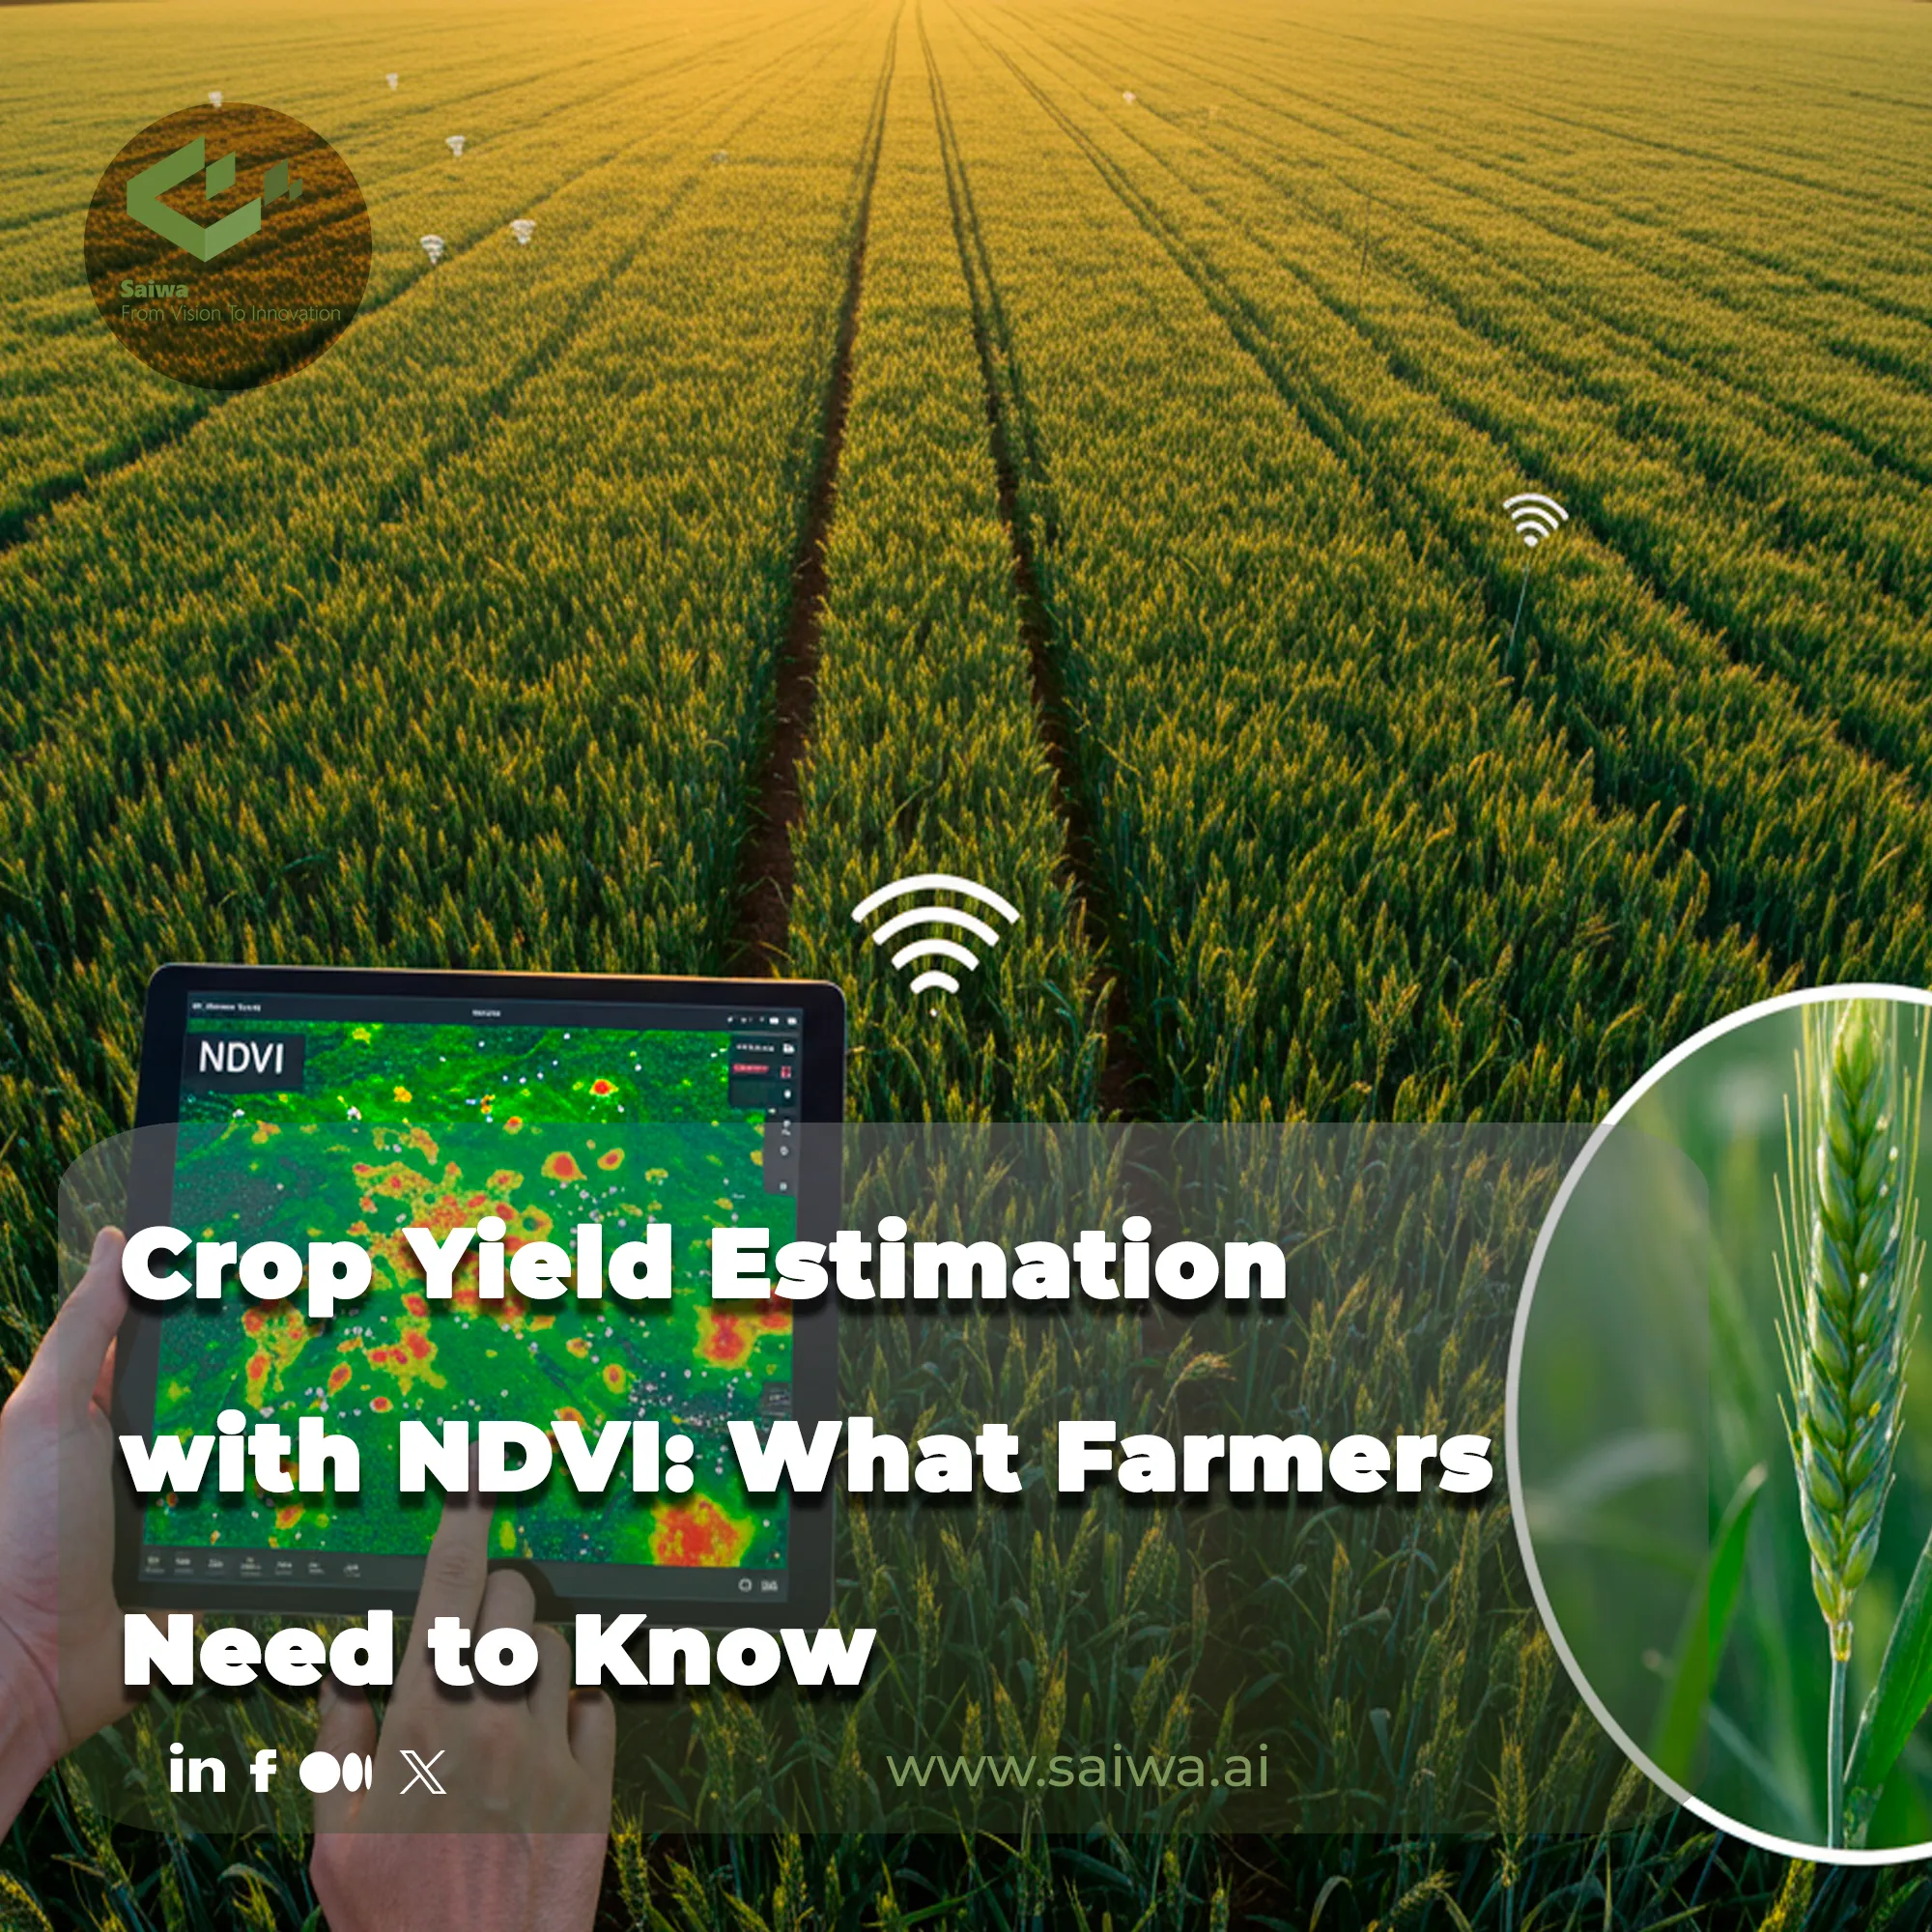
Farming has always relied on careful observation, but in recent years it has also become a field of precise measurement. With satellites and drones providing detailed images, growers can monitor crop conditions throughout the season rather than waiting until harvest. Among the different tools developed for this purpose, the Normalized Difference Vegetation Index (NDVI) is one of the most established. By comparing how plants reflect visible and near-infrared light, NDVI offers a reliable way to assess crop vigor and anticipate yield potential.
To leverage such data at scale, Sairone, developed by Saiwa, offers farmers and researchers processed aerial imagery and clear reporting. The scope of its services encompasses greenhouse management, environmental monitoring, and field-level analysis, with Crop Yield Estimation being recognized as one of its most practical applications.
This blog post explores how NDVI is used to estimate crop yield, the most common methods, and what producers should keep in mind when using vegetation indices to make forecasts for their own operations.

How NDVI Reflects Crop Yield Potential
The Normalized Difference Vegetation Index (NDVI) is a straightforward yet powerful metric that quantifies the health and vigor of green vegetation. It operates on a simple principle: healthy plants, rich in chlorophyll, are excellent absorbers of visible light (particularly in the red spectrum) for photosynthesis, while their cell structure makes them strong reflectors of near-infrared (NIR) light.
The NDVI algorithm contrasts these two bands, generating a value between -1 and +1. Higher values (typically > 0.5) correspond directly to greater leaf area density, higher chlorophyll concentration, and increased photosynthetic capacity, which are all key drivers of biomass accumulation and, ultimately, crop yield potential.
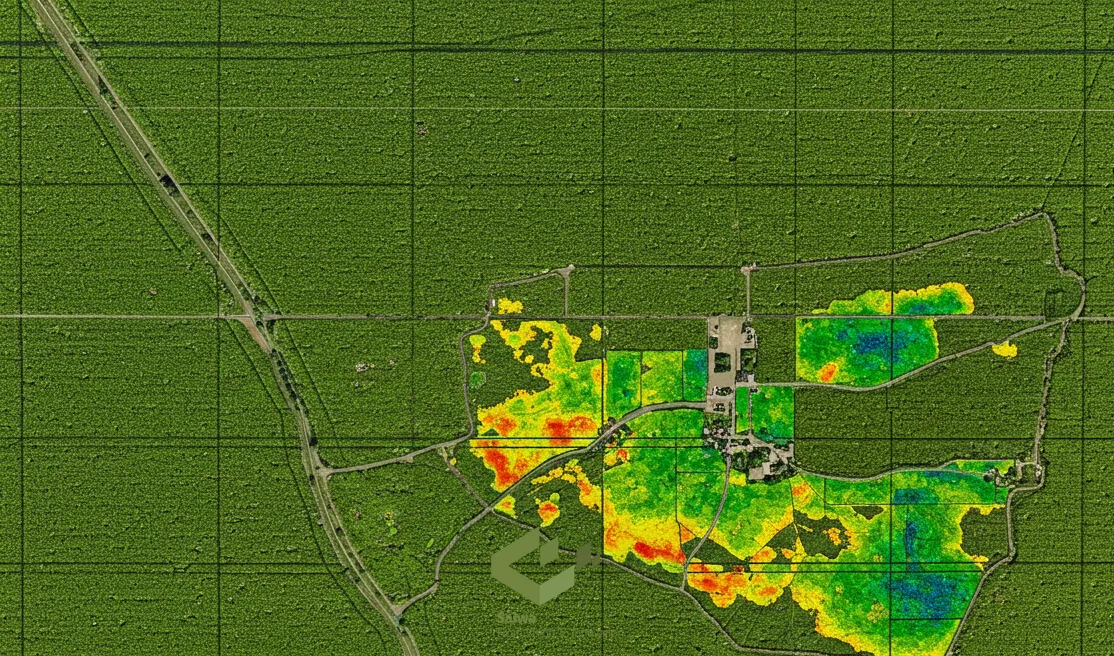
Sources of NDVI Data and Image Acquisition Tools
Extracting reliable NDVI data is the foundational step for any remote sensing application in agriculture. The quality and resolution of this data directly impact the accuracy of any subsequent analysis. Fortunately, producers today have access to a growing array of powerful image acquisition tools. Let's explore the most common sources:
• Common satellite platforms (Landsat, Sentinel, MODIS): These government- and agency-operated satellites are the workhorses of large-scale agricultural monitoring. Platforms like MODIS provide frequent, broad-scale coverage ideal for regional analysis, while Sentinel and Landsat offer higher spatial resolutions suitable for farm-level insights.
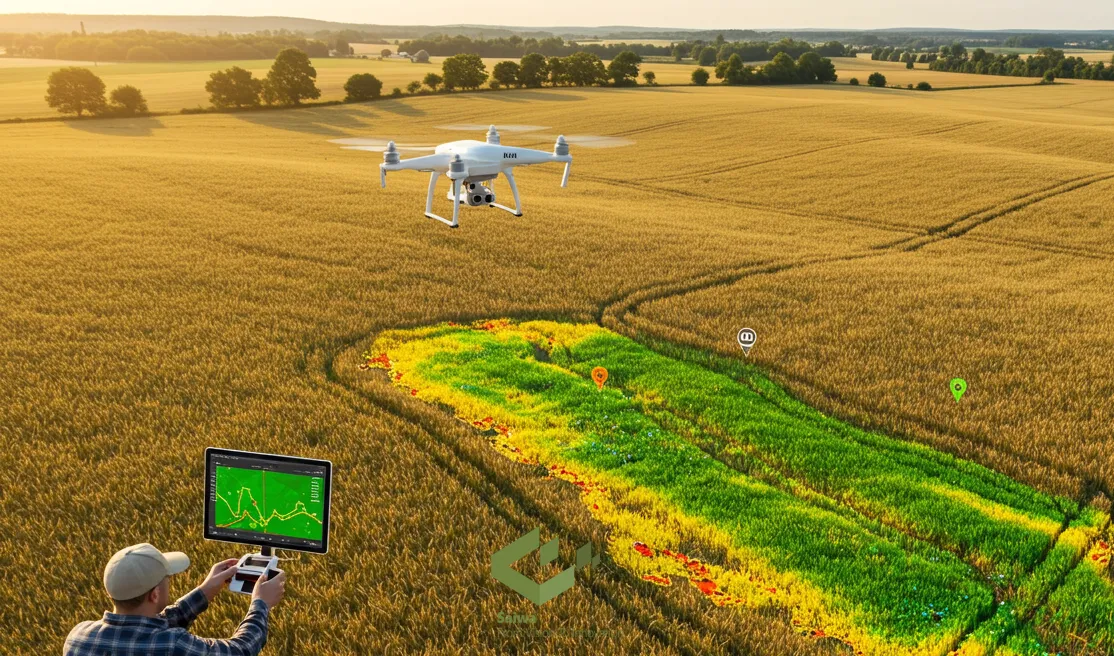
• UAV/drone-based NDVI sensing for high-resolution needs: For ultra-precise applications, Unmanned Aerial Vehicles (UAVs) equipped with multispectral sensors offer unparalleled detail. AI drones can capture imagery at resolutions of mere centimeters per pixel, enabling a granular view of crop health that is impossible to achieve from space and is ideal for early-stage stress detection.
• NDVI generation from multispectral bands: Regardless of the platform, the process is the same: a multispectral sensor captures data from distinct light bands. The NDVI value for each pixel is then calculated using the mathematical formula: (NIR - Red) / (NIR + Red).
Common NDVI-Based Yield Estimation Techniques
Once NDVI imagery is acquired, various analytical techniques can be employed to transform these "greenness" maps into quantitative yield forecasts. The sophistication of these methods varies, but each aims to establish a reliable correlation between the NDVI signal and final harvest numbers. Understanding these core methods is crucial for an effective Crop yield Estimation with NDVI.
NDVI thresholds and regression models
At its most basic, thresholds can be set to classify areas as "high," "medium," or "low" vigor. However, for a true forecast, regression models are used. Simple linear regression, for instance, can establish a statistical relationship where increases in NDVI values correspond to a predictable increase in bushels per acre.
Use of peak NDVI vs cumulative NDVI over growing season
Research has shown that different NDVI metrics offer unique insights. Peak NDVI, the single highest NDVI value recorded during the key growth stages, often serves as a very strong predictor of final yield. In contrast, cumulative NDVI integrates the values over the entire growing season, providing a measure of the total photosynthetic activity throughout the plant's life cycle.
Multitemporal NDVI patterns for seasonal monitoring
Perhaps the most advanced approach involves multitemporal analysis. By capturing and comparing a series of NDVI images over time, it’s possible to track the crop’s growth trajectory, identify anomalies, and see how its development curve compares to previous successful seasons or different zones within the same field.
NDVI Limitations Farmers Should Understand
NDVI is one of the most practical tools in remote sensing, but it should not be treated as a universal proxy for yield in every field and every growth stage. A 2025 review and meta-analysis summarized by NASA found that NDVI can serve as a standalone predictor, yet its generalizability and accuracy are limited by observation timing, the statistical method used, and the production environment.
The same review warns that relying only on NDVI in simple linear regression models can lead to unrealistic yield estimates, especially at large scales or when peak NDVI is used without additional context.
Why timing matters more than many growers expect
An NDVI image only captures one moment in the season. That makes timing critical, because the same NDVI value can mean different things at early vegetative growth, peak canopy, or grain fill.
A classic multitemporal study on crop yield monitoring found that yield estimates from NDVI profiles could stabilize 50 to 100 days before harvest, but also noted that agro-meteorological model input was recommended during grain filling to improve reliability.
For farm managers, the practical lesson is simple: a single NDVI map is useful for scouting, but repeated observations across the season are far more reliable for forecasting. Multitemporal analysis helps distinguish a strong crop that is progressing normally from a crop that only looks vigorous for a short window before stress appears later.
Where NDVI becomes less reliable
One of the best-known NDVI limitations is saturation in dense, healthy canopies. The NASA summary reports that NDVI saturation becomes a problem particularly above values of 0.75, which can lead to inaccurate yield estimation because the index loses sensitivity as biomass continues to increase.
That means two high-performing zones may show very similar NDVI values even if one still has more yield potential than the other. This is especially important in crops or growth stages with dense leaf area, where NDVI may flatten while agronomic differences still matter.
The same NASA review also notes that spatial, temporal, spectral, and radiometric uncertainties can introduce additional error into the NDVI-yield relationship. In practice, that includes issues such as inconsistent image timing, background soil effects, sensor differences, and local environmental variation.
When to use complementary indices
Field condition | Why NDVI may be limited | Better interpretation approach |
Dense mid- to late-season canopy | NDVI can saturate and lose sensitivity at high vegetation levels. | Add chlorophyll-sensitive indices or multitemporal analysis instead of relying on peak NDVI alone. |
Early-stage crops or exposed soil | Soil background can distort general greenness readings. | Use SAVI when soil brightness is a strong influence. |
Nitrogen-focused crop assessment | NDVI shows vigor, but not always the clearest chlorophyll signal in later growth stages. | Use GNDVI when chlorophyll and nitrogen interpretation matter more directly. |
Yield forecasting across variable seasons | NDVI alone may miss weather and grain-fill effects. | Combine NDVI with weather, soil, and management data in a hybrid model. |
What this means in practice
The strongest use of NDVI is as a baseline indicator, not a final answer. It is highly valuable for zoning fields, tracking crop vigor, and supporting early yield forecasting, but it becomes much more dependable when paired with growth-stage timing, complementary indices, and non-imagery data.
That is exactly why the next step in the article, hybrid modeling with weather, soil, and management layers, is so important: it reduces the risk of making high-stakes yield decisions from a single greenness metric alone.
Machine Learning & Hybrid Modeling Using NDVI
While NDVI is a powerful indicator, its predictive power is significantly amplified when integrated into hybrid models. Machine learning (AI) algorithms can combine NDVI data with other critical agronomic and environmental datasets to uncover complex, non-linear relationships invisible to simpler statistical methods.
Specialized platforms like Saiwa's Sairone (for agricultural automation) and Fraime (for core AI capabilities like object detection or anomaly detection) excel at these advanced analytical tasks.

Combining NDVI with weather, soil, and management data
The real power of AI is unlocked when NDVI is treated as just one variable among many. Factors like rainfall totals, growing degree days, soil nutrient maps, and planting density all contribute to the final yield.
Example: NDVI + rainfall + temperature + soil maps
A hybrid model might learn that in a field with sandy soil, a high NDVI value is far more dependent on consistent rainfall than in a field with loam soil, leading to a more nuanced and accurate Crop Yield Estimation with NDVI.
AI models (e.g. Random Forest, SVR, LSTM) in yield forecasting
Algorithms like Random Forest and Support Vector Regression (SVR) are exceptionally skilled at handling diverse datasets to produce robust yield predictions. Long Short-Term Memory (LSTM) networks, a type of deep learning model, are particularly adept at analyzing time-series data, making them ideal for multitemporal NDVI analysis.
Case Studies and Empirical Research Highlights
The value of NDVI is not theoretical but is backed by extensive empirical research. These studies consistently link NDVI measurements to actual harvest data, though several key factors can influence performance.
Regional studies on crops like maize, wheat, rice
Research on major crops like corn and wheat confirms the strong correlation between satellite NDVI and yields. Higher image resolution significantly boosts model accuracy by reducing signal noise from non-crop elements.
Timing of NDVI observations and yield prediction performance (R², RMSE)
Image acquisition timing is critical. Data captured around the peak vegetative stage consistently shows the highest correlation with final yield, verified by strong statistical measures like a high R² and low RMSE.
NDVI reliability across climates (humid vs semi-arid)
Model performance can vary by climate. Exposed soil in semi-arid regions or signal saturation in humid, dense canopies are factors that require advanced modeling to properly address.
Read Also : How to Increase Wheat Crop Yield - Modern Methods for Higher Output
Benefits of Using NDVI for Yield Estimation
Adopting an NDVI-based approach to Crop yield estimation and Plant health monitoring offers a suite of tangible benefits for modern farm management. By shifting from reactive problem-solving to proactive, data-informed strategy, producers can unlock new levels of efficiency and profitability. Here are some of the most compelling advantages:
• Non-invasive, cost-effective, and scalable: Remote sensing assesses crop health without disturbing plants. The technology scales easily from a single field to an entire region at a far lower cost than intensive ground-scouting.
• Enables early yield predictions and proactive decisions: Early yield indicators allow for timely interventions. Identifying underperforming zones can guide variable-rate input strategies to correct deficiencies before they significantly impact yield.
• Historical yield trend mapping with archived imagery: Vast satellite archives allow producers to analyze historical data, map long-term productivity trends, and identify consistently high- or low-performing zones to inform future management decisions.
Looking Ahead: The Future of NDVI in Yield Estimation
The future of NDVI-based analytics in agriculture is bright and centered on higher fidelity. The trend is toward a fusion of data sources: the consistent, large-scale coverage of satellites like the Sentinel constellation, which provides 10-meter resolution data every few days, combined with on-demand, hyper-resolution drone imagery for targeted scouting.
As machine learning models become more sophisticated and cloud computing power more accessible, these fused datasets will enable near-real-time predictive models that are more accurate and reliable than ever before.
Read Also : Applications of GIS in Agriculture | Turning Data Into Decisions
Modern Advances: Red-Edge Indices, High-Resolution Micro-NDVI, and Transformer Models
While traditional NDVI remains a foundational metric for crop health assessment, modern precision agriculture is rapidly adopting complementary techniques to overcome its classic technical limitations—most notably saturation in dense canopies and sensitivity to soil background reflection.
Overcoming NDVI Saturation with NDRE and EVI
During peak growth stages, when leaf area index (LAI) is high, standard red light absorption saturates, causing NDVI values to plateau even as crop biomass continues to accumulate. To maintain high analytical sensitivity throughout the entire growing season, hybrid yield forecasting platforms integrate additional spectral bands:
Normalized Difference Red Edge (NDRE): Utilizes the red-edge transition band (705–740 nm), which penetrates deeper into dense crop canopies. This allows for accurate chlorophyll and nitrogen estimation during late-stage maturation when standard NDVI saturates.
Enhanced Vegetation Index (EVI): Incorporates blue light wavelengths to correct for atmospheric scattering and soil background noise, providing higher fidelity in early growth stages or sparse crop stands.
High-Resolution Micro-NDVI via UAVs
While satellite constellation imagery provides excellent macro-level temporal coverage, cloud cover and spatial resolution limits (typically 3–10 meters) can blur localized crop stress. Leveraging drone platforms like Sairone, agronomists now capture sub-centimeter multispectral data. This ultra-high spatial resolution enables pixel-level masking that isolates pure plant foliage from shadows, bare soil, and inter-row weeds—preventing non-crop pixels from skewing whole-field NDVI averages and yield forecasts.
From LSTMs to Temporal Vision Transformers
Building upon classic time-series algorithms like LSTMs, modern machine learning pipelines are increasingly adopting Temporal Vision Transformers and self-attention networks for yield prediction. These advanced models process multi-temporal satellite and UAV image sequences alongside hyper-local weather telemetry and soil moisture feeds simultaneously. By modeling complex spatio-temporal dependencies across different growth stages, transformer-based architectures achieve superior yield prediction accuracy weeks prior to harvest.
By combining red-edge spectral indices, ultra-high-resolution drone analytics, and deep transformer architectures, growers can extend the predictive power of vegetation modeling far beyond standard NDVI, driving more precise resource management and reliable harvest forecasting.
Conclusion
NDVI is more than just a colorful map; it is a powerful data-driven tool that transforms invisible spectral signals into a measurable assessment of crop health and productivity. When integrated with modern AI and machine learning platforms, it empowers farmers to manage their operations with unprecedented precision. Embracing this technology is a critical step forward in the ongoing practice of Crop yield estimation with NDVI.
Note: Some visuals on this blog post were generated using AI tools.
Comments
No comments yet!
Table of Contents
No headings were found on this page.