Aerial Image Analysis for AI-Based Weed Identification
Learn how drone imagery and AI help detect weeds, generate weed maps, support targeted spraying, and improve decision-making in precision agriculture.
Written by Amirhossein
Reviewed by Boshra
Introduction
Weeds compete with crops for light, water, and nutrients, which can reduce crop performance and increase management costs. Conventional broadcast herbicide application may also apply chemicals to parts of the field where treatment is not necessary, increasing input use and environmental burden.
AI-based analysis of drone imagery has emerged as a precision agriculture approach for detecting and mapping weeds from aerial data. However, the effectiveness of these systems varies across studies because performance depends on crop type, weed density, sensor choice, image quality, annotation quality, and field conditions.
This article explains how aerial weed detection works, what affects model performance, how weed maps can support targeted spraying, and how platforms such as Sairone fit into operational workflows.
How Drone-Based Weed Detection Works
Core workflow
Drone-based weed detection converts aerial images into maps that show where weeds are likely to be present. A typical workflow includes image capture, preprocessing, plant detection or segmentation, classification, and output generation for field use.
In practice, the system may classify each pixel, detect individual plants, or combine both approaches depending on the model and the intended output. The final result is usually a weed distribution layer that can support scouting, mapping, or targeted treatment planning.
AI models
Deep learning models are widely used in this area because they can learn visual differences among crops, weeds, and soil from annotated image datasets. Common approaches include convolutional neural networks, object detection models in the YOLO family, and transformer-based architectures, but their performance depends strongly on the training data and deployment scenario.
Processing options
Image processing can be performed either onboard the UAV or after the flight in a cloud-based system. Onboard processing can support near-real-time decisions, while cloud processing usually offers more flexibility and lower hardware constraints at the cost of delayed output.

Sensor Options for Weed Mapping
RGB imagery
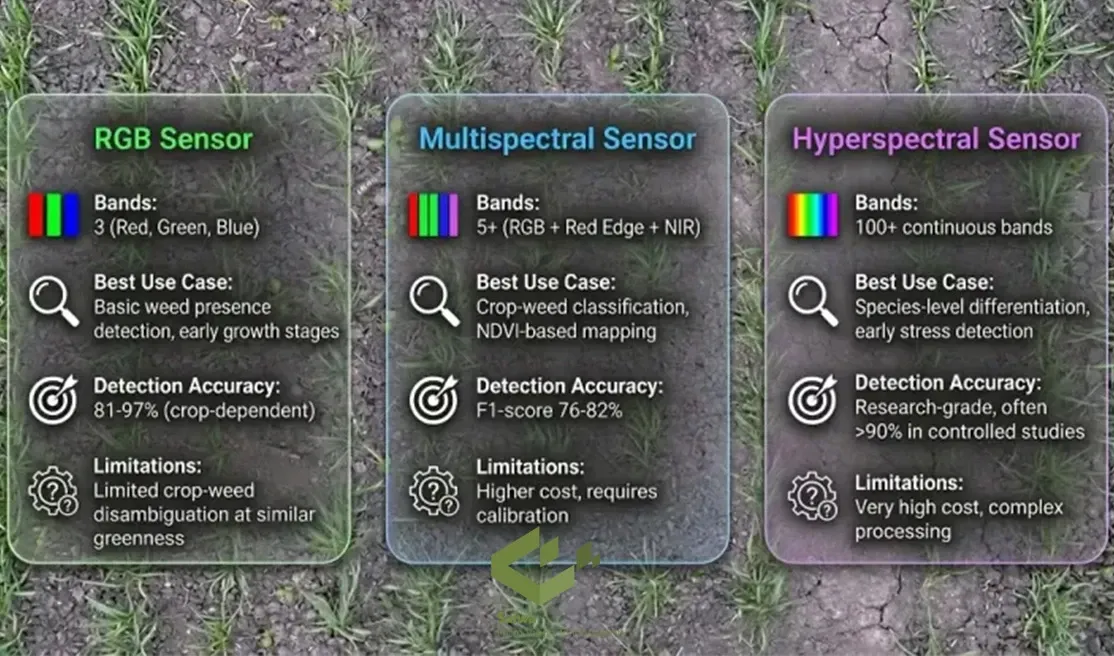
Sensor choice strongly affects how well weeds can be separated from crops and soil. RGB imagery is often sufficient for basic visual detection, but it can struggle when crops and weeds appear similarly green or when small weeds occupy only a few pixels.
RGB performance is also sensitive to flight altitude because increasing altitude reduces spatial detail. This makes early-stage or small weed detection more difficult in practical field conditions.
Multispectral imagery
Multispectral sensors add bands such as red edge and near-infrared, which can improve vegetation analysis beyond standard RGB imagery. These bands may support indices such as NDVI and improve crop-weed separation in some scenarios, especially when visual differences are weak.
Even so, reported F1-scores and related metrics should be interpreted as study-specific results rather than universal benchmarks. Their meaning depends on the dataset, class design, crop stage, and evaluation protocol.
Hyperspectral imagery
Hyperspectral imaging captures many narrow spectral bands and can help distinguish plant species with subtle spectral differences. However, because these systems are more expensive and more complex to operate, they remain more common in research and specialized applications than in routine commercial use.
Detection Performance in the Field
Why results vary
Reported weed detection performance varies widely across crops, weed populations, sensor types, and evaluation methods. For that reason, individual accuracy values should be presented as findings from specific studies rather than as general expectations for all farms.
Row crops and dense canopies
Some tomato-field studies have reported high weed detection performance under favorable conditions, especially where weeds are visually separable from crop rows. However, such values should be interpreted carefully because they reflect particular datasets, field layouts, and evaluation settings rather than universal performance in all tomato fields.
Weed detection in maize is often more difficult because crop structure, leaf overlap, and canopy density can obscure weed boundaries. In dense canopies, small weeds and partially hidden plants are more likely to be missed or misclassified.
Interpreting metrics
Model scores differ substantially across studies because some tasks involve only one weed class while others require multi-class detection in visually complex crop backgrounds. As a result, values such as mAP, precision, recall, or F1-score are meaningful only when they are interpreted within the experimental setup that produced them.
From Weed Mapping to Targeted Spraying
Field preparation and data input
Successful weed mapping depends on image overlap, flight altitude, lighting conditions, and the target ground sampling distance. Recommended overlap settings can be useful operational guidance, but they should be treated as study-based recommendations rather than fixed rules for every workflow.
Platforms may accept georeferenced orthomosaics such as GeoTIFF files or standard image formats, depending on the intended output. Confidence thresholds also affect the trade-off between false positives and missed detections, so threshold selection should be aligned with the practical goal of the analysis.
Output and integration
Weed detection systems may export results in GIS-compatible formats that support mapping, scouting, and application planning. These outputs can then be integrated into broader farm management workflows or used to generate prescription maps for targeted field operations.
AI-generated weed maps can support targeted herbicide application by defining management zones instead of treating the entire field uniformly. In practice, this integration depends on the software environment, file compatibility, and the spraying workflow rather than a single universal transfer method.
Herbicide reduction
Field trials in spot spraying have reported meaningful reductions in herbicide use relative to broadcast application. In one sugarcane study cited in the source text, spot spraying was reported to be 97% as effective as broadcast spraying while reducing herbicide use by 35% on average, with reductions of up to 65% in lower weed-pressure strips.
These results are useful, but they should be treated as context-specific findings rather than universal expectations. Savings depend on crop type, weed pressure, map quality, application method, and local operating conditions.
Environmental effects
Targeted spraying may also reduce herbicide movement into runoff when less product is applied to the field. In the same sugarcane line of evidence, reductions were reported in both herbicide concentration and herbicide load in runoff, but these outcomes depend on site conditions, water movement, and application coverage.
Economic and Practical Limitations
Labor and ROI
Drone-based scouting can reduce the need for manual field inspection, especially across large areas. Even so, labor savings depend on how data are collected, reviewed, validated, and integrated into farm operations, so broad percentage claims should be treated with caution unless they are tied to a clearly defined study design.
The economic return of drone-based weed detection depends on farm size, crop value, herbicide costs, labor availability, equipment ownership, and service pricing. Because these variables differ substantially across operations, break-even timelines should be presented as scenario-based estimates rather than fixed expectations.
Data quality and generalization
Model performance depends heavily on data quality. Poor annotation, limited species diversity, and insufficient field variability can reduce generalization to new conditions, which is why model updating with new labeled field data is often necessary for reliable deployment.
Model improvement over time is possible, but it is not automatic. Better results require a structured process that includes accurate labeling, retraining, and validation under new field conditions.
Sairone as an Operational Example
Sairone can be presented as an example of how AI-based weed detection is deployed in practice for agriculture and environmental monitoring. According to Saiwa’s platform materials, Sairone supports cloud-based use, API integration, and white-label deployment for applications such as weed and invasive plant control and related field analytics.
According to the platform page, Sairone accepts inputs such as aerial images, videos, orthophoto or TIFF imagery, and other visual data sources, then provides outputs such as weed distribution maps and GIS-compatible export files including GeoJSON, Shapefile, KML, and CSV.
For that reason, the soybean example in the original draft is better framed as a practical use case rather than as independent scientific proof of performance. A careful formulation is that the platform is designed to process aerial imagery and produce outputs that can support weed mapping and treatment planning in crops such as soybean.
Conclusion
AI-based aerial weed detection is a promising tool for precision agriculture, especially where growers need scalable field monitoring and more targeted weed management. Its practical value is strongest when image quality, field conditions, model training data, and downstream spraying workflows are aligned with the intended use case.
Rather than relying on a single headline accuracy value, decision-makers should compare systems based on sensor suitability, field conditions, workflow integration, and evidence from relevant crop scenarios. This makes the evaluation more realistic and more scientifically defensible.
Comments
No comments yet!
Table of Contents
No headings were found on this page.